

Question: Using the data in Table 1.2, graphically illustrate the relationship between a countrys per capita GDP and its per capita municipal waste generation. What conclusion
Graph
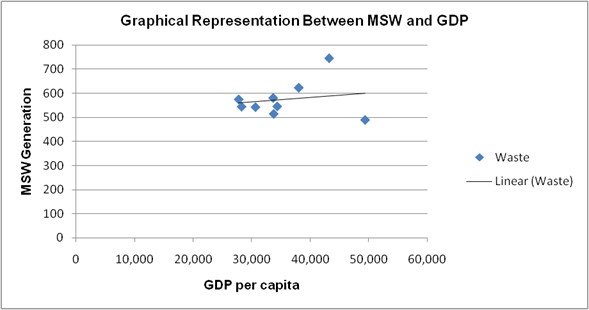
Graphical Representation Between MSW and GDP 800 700 600 500 400 Waste 300 - Linear (Waste) 200 100 10,000 20,000 30,000 40,000 50,000 60,000 GDP per capita MSW Generation
Step by Step Solution
★★★★★
3.49 Rating (162 Votes )
There are 3 Steps involved in it
1 Expert Approved Answer
Step: 1 Unlock

As discussed in the text and as indicated by the slope of the trend line in the above graphi... View full answer
Question Has Been Solved by an Expert!
Get step-by-step solutions from verified subject matter experts
Step: 2 Unlock
Step: 3 Unlock