

The diagram shows a sketch of part of the curve with equation y = x 2 +
Question:
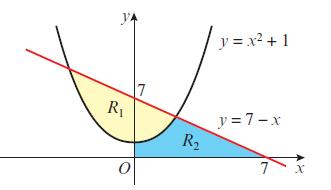
The diagram shows a sketch of part of the curve with equation y = x2 + 1 and the line with equation y = 7 − x.
The finite region, R1 is bounded by the line and the curve.
The finite region, R2 is below the curve and the line and is bounded by the positive x- and y-axes as shown in the diagram.
a. Find the area of R1.
b. Find the area of R2.
Fantastic news! We've Found the answer you've been seeking!
Step by Step Answer:
a Find the area of R1 Region R1 is bounded by the line y 7 x and the curve y x2 1 To find the area of this region we need to find the points of inters...View the full answer

Answered By
Mary Boke
I have teached the student upto class 12th as well as my fellow mates.I have a good command in engineering,maths and science.I scored 90+ marks in 10th and 12th in maths.
0 Reviews
10+ Question Solved
Related Book For 

Edexcel AS And A Level Mathematics Pure Mathematics Year 1/AS
ISBN: 9781292183398
1st Edition
Authors: Greg Attwood
Question Posted:
