

The diagram shows the curve with equation y = 5 x 2 and the line with
Question:
The diagram shows the curve with equation y = 5 − x2 and the line with equation y = 3 − x. The curve and the line intersect at the points P and Q.
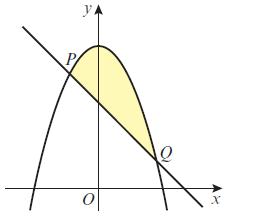
a. Find the coordinates of P and Q.
b. Find the area of the finite region between PQ and the curve.
Fantastic news! We've Found the answer you've been seeking!
Step by Step Answer:
a To find the coordinates of points P and Q we need to set the equations of the curve and the line e...View the full answer

Answered By
User l_917591
As a Business Management graduate from Moi University, I had the opportunity to work as a tutor for undergraduate students in the same field. This experience allowed me to apply the theoretical knowledge I had gained in a practical setting, while also honing my teaching and communication skills.
As a tutor, I was responsible for conducting tutorial sessions, grading assignments and exams, and providing feedback and support to my students. I also assisted with the preparation of course materials and collaborated with other tutors and professors to ensure consistency in teaching and assessment.
0 Reviews
10+ Question Solved
Related Book For 
Edexcel AS And A Level Mathematics Pure Mathematics Year 1/AS
ISBN: 9781292183398
1st Edition
Authors: Greg Attwood
Question Posted:
