

Without performing any calculations, determine which measure of central tendency best represents the graphed data. Explain your
Question:
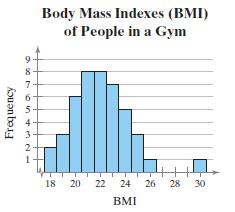
Without performing any calculations, determine which measure of central tendency best represents the graphed data. Explain your reasoning.
Fantastic news! We've Found the answer you've been seeking!
Step by Step Answer:
The graphed data represents the mode because from the giv...View the full answer

Answered By
Hassan Ali
From my school time, I really have a keen interest in mathematics. Not just boring stuff like hectic calculations and all, but the beauty of subject. Thatswhy I graduated and post graduated in mathematics, and decided to the research in the same subject as well. Mathematics is that subject for me, from which I never get feel bored. Thatswhy, either it was my school time or college time, I tutored students at different level. I really like to solve the student problems, because those problems help me to understand my subject a lot in exceptional way. So, because of all these things, I think I can tutor students without boredom and in a joyful manner.
0 Reviews
10+ Question Solved
Related Book For 

Elementary Statistics Picturing The World
ISBN: 9780134683416
7th Edition
Authors: Ron Larson, Betsy Farber
Question Posted:
