

Question: Find the sample variance and the sample standard deviation for the frequency distribution of the data shown. The data represent the number of miles that
Find the sample variance and the sample standard deviation for the frequency distribution of the data shown. The data represent the number of miles that 20 runners ran during one week.
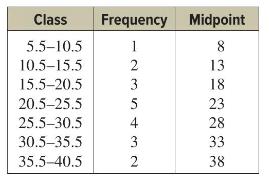
Class Frequency Midpoint 5.5-10.5 10.5-15.5 15.5-20.5 20.5-25.5 25.5-30.5 30.5-35.5 35.5-40.5 1235 +32 8 13 18 23 4 28 33 38
Step by Step Solution
★★★★★
3.50 Rating (160 Votes )
There are 3 Steps involved in it
1 Expert Approved Answer
Step: 1 Unlock

Step 1 Make a table as shown and find the midpoint of each class Step 2 Multiply the fre... View full answer
Question Has Been Solved by an Expert!
Get step-by-step solutions from verified subject matter experts
Step: 2 Unlock
Step: 3 Unlock