

Question: For Exercises do a complete regression analysis. a. Draw the scatter plot. b. Compute the value of the correlation coefficient. c. Test the significance of
For Exercises do a complete regression analysis.
a. Draw the scatter plot.
b. Compute the value of the correlation coefficient.
c. Test the significance of the correlation coefficient at α = 0.05.
d. Determine the regression line equation if r is significant.
e. Plot the regression line on the scatter plot if appropriate.
f. Predict Ý for a specific value of x if appropriate.
A study is conducted with a group of dieters to see if the number of grams of fat each consumes per day is related to cholesterol level. The data are shown here. If there is a significant relationship, predict the cholesterol level of a dieter who consumes 8.5 grams of fat per day.
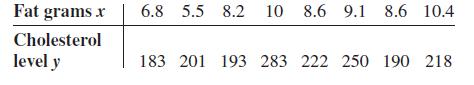
Fat grams .x Cholesterol level y 6.8 5.5 8.2 10 8.6 9.1 8.6 10.4 183 201 193 283 222 250 190 218
Step by Step Solution
3.39 Rating (168 Votes )
There are 3 Steps involved in it
To perform a complete regression analysis for the given data lets follow the steps outlined in the question a Draw the scatter plot First we plot the ... View full answer

Get step-by-step solutions from verified subject matter experts