

Question: For Exercises perform the following steps. a. Draw the scatter plot for the variables. b. Compute the value of the correlation coefficient. c. State the
For Exercises perform the following steps.
a. Draw the scatter plot for the variables.
b. Compute the value of the correlation coefficient.
c. State the hypotheses.
d. Test the significance of the correlation coefficient at α = 0.05, using Table I.
e. Give a brief explanation of the type of relationship.
Assume all assumptions have been met.
The annual energy consumption in billions of Btu for both natural gas and coal is shown for a random selection of states. Is there a linear relationship between the variables?
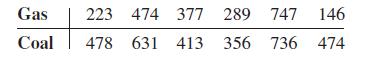
Gas 223 474 377 289 747 146 Coal 478 631 413 356 736 474
Step by Step Solution
3.47 Rating (167 Votes )
There are 3 Steps involved in it
ANSWER a Draw the scatter plot for the variables Scatter plot with Natural Gas on the xaxis and Coal ... View full answer

Get step-by-step solutions from verified subject matter experts