

Question: For Exercises perform the following steps. a. Draw the scatter plot for the variables. b. Compute the value of the correlation coefficient. c. State the
For Exercises perform the following steps.
a. Draw the scatter plot for the variables.
b. Compute the value of the correlation coefficient.
c. State the hypotheses.
d. Test the significance of the correlation coefficient at α = 0.05, using Table I.
e. Give a brief explanation of the type of relationship.
Assume all assumptions have been met.
Is there a relationship between the life expectancy for men and the life expectancy for women in a given country? A random sample of non industrialized countries was selected, and the life expectancy in years is listed for both men and women. Are the variables linearly related?
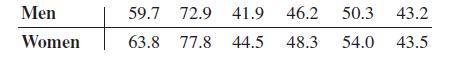
Men Women 59.7 72.9 41.9 46.2 50.3 43.2 63.8 77.8 44.5 48.3 54.0 43.5
Step by Step Solution
3.39 Rating (168 Votes )
There are 3 Steps involved in it
a To draw a scatter plot the data points of both variables can be plotted on a graph with the life e... View full answer

Get step-by-step solutions from verified subject matter experts