

Question: For Exercises perform the following steps. a. Draw the scatter plot for the variables. b. Compute the value of the correlation coefficient. c. State the
For Exercises perform the following steps.
a. Draw the scatter plot for the variables.
b. Compute the value of the correlation coefficient.
c. State the hypotheses.
d. Test the significance of the correlation coefficient at α = 0.05, using Table I.
e. Give a brief explanation of the type of relationship.
Assume all assumptions have been met.
School administrators wondered
whether class size and grade achievement (in percent)
were related. A random sample of classes revealed
the following data. Are the variables linearly related?
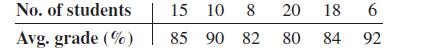
No. of students Avg. grade (%) 15 10 8 20 18 6 85 90 82 80 84 92
Step by Step Solution
3.39 Rating (155 Votes )
There are 3 Steps involved in it
ANSWERS a Draw the scatter plot for the variables The scatter plot would look like this No of studen... View full answer

Get step-by-step solutions from verified subject matter experts