

Question: In each of the Exercises, the quantitative data set under consideration has roughly a bell-shaped distribution. For each exercise, a. Construct a graph similar to
In each of the Exercises, the quantitative data set under consideration has roughly a bell-shaped distribution. For each exercise,
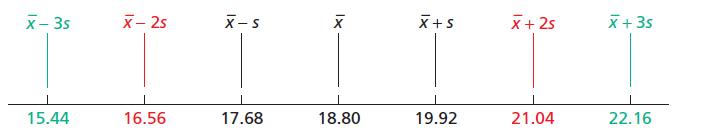
a. Construct a graph similar to Fig. 3.8.
b. Apply Property 1 of the empirical rule to make pertinent statements about the observations in the sample.
c. Repeat part (b) for Property 2 of the empirical rule.
d. Repeat part (b) for Property 3 of the empirical rule.
Fig. 3.8
The PGA TOUR provides various statistics on performance of players in the Professional Golfers’ Association of America. For the week ending September 9, 2013, the year-to-date leader for longest average drive was Bubba Watson. For his 773 drives, he averaged 298.5 yards. Assume a standard deviation of 19.7 yards.
X-3s 15.44 X-2s 16.56 X-S 17.68 Ix 18.80 X+S 19.92 X + 2s 21.04 x + 3s 22.16
Step by Step Solution
3.38 Rating (157 Votes )
There are 3 Steps involved in it
a Based on the fact that the sample mean is 2985 yards and the sample standard deviation is 197 yard... View full answer

Get step-by-step solutions from verified subject matter experts