

Question: Refer to Exercise 8.78. a. The mean duration for a sample of 612 dives was 322 seconds. Find a 99% confidence interval for based
Refer to Exercise 8.78.
a. The mean duration for a sample of 612 dives was 322 seconds. Find a 99% confidence interval for μ based on that data.
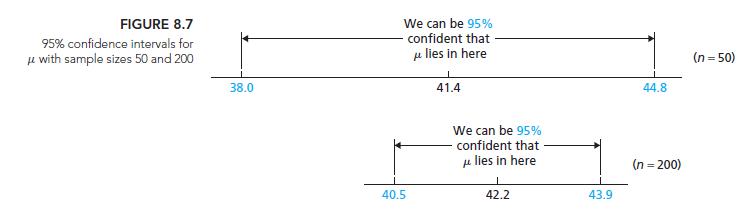
b. Compare the 99% confidence intervals obtained here and in Exercise 8.78(b) by drawing a graph similar to Fig. 8.7 on page 327.
c. Compare the margins of error for the two 99%confidence intervals.
d. What principle is being illustrated?
Fig. 8.7
Exercise 8.78
Multi-sensor data loggers were attached to free-ranging American alligators in a study conducted by Y. Watanabe for the article “Behavior of American Alligators Monitored by Multi-Sensor Data Loggers”. The mean duration for a sample of 68 dives was 338.0 seconds. Assume the population standard deviation is 100 seconds.
a. Find a 95% confidence interval for the mean duration, μ, of an American-alligator dive.
b. Repeat part (a) at a 99% confidence level.
c. Draw a graph similar to Fig. 8.6 on page 326 to display both confidence intervals.
d. Which confidence interval yields a more accurate estimate of μ?
Explain your answer
FIGURE 8.7 95% confidence intervals for with sample sizes 50 and 200 38.0 We can be 95% confident that lies in here 40.5 I 41.4 We can be 95% confident that lies in here 1 42.2 43.9 44.8 (n = 200) (n = 50)
Step by Step Solution
3.39 Rating (168 Votes )
There are 3 Steps involved in it
a c b The margin of error for this exercise is 33241 31159 2 1041 seconds while the margin o... View full answer

Get step-by-step solutions from verified subject matter experts