

Question: Shown are various statistics about the Great Lakes. Using appropriate graphs (your choice) and summary statements, write a report analyzing the data. Length (miles) Breadth
Shown are various statistics about the Great Lakes. Using appropriate graphs (your choice) and summary statements, write a report analyzing the data.
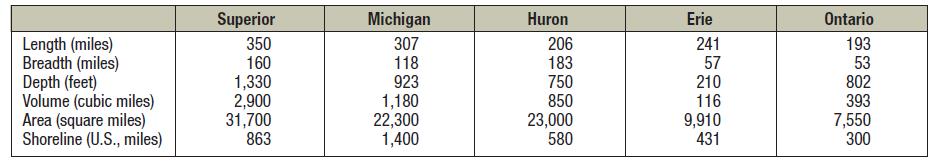
Length (miles) Breadth (miles) Depth (feet) Volume (cubic miles) Area (square miles) Shoreline (U.S., miles) Superior 350 160 1,330 2,900 31,700 863 Michigan 307 118 923 1,180 22,300 1,400 Huron 206 183 750 850 23,000 580 Erie 241 57 210 116 9,910 431 Ontario 193 53 802 393 7,550 300
Step by Step Solution
3.40 Rating (156 Votes )
There are 3 Steps involved in it
Given that the various statistics about the are Huron Len... View full answer

Get step-by-step solutions from verified subject matter experts