

Question: Using the data from Data Set I in Appendix B, make a stem and leaf plot for the record low temperatures in the United States.
Using the data from Data Set I in Appendix B, make a stem and leaf plot for the record low temperatures in the United States. Describe the nature of the plot.
Data from Set I Appendix B
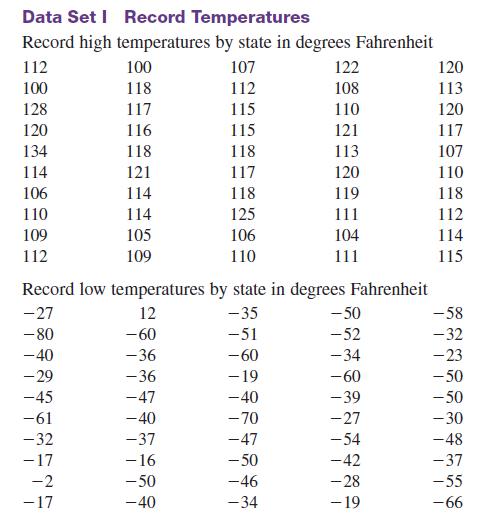
Data Set I Record Temperatures Record high 112 100 128 120 134 114 106 110 109 112 temperatures by state in degrees Fahrenheit 107 112 115 115 118 117 118 125 106 110 -45 -61 -32 - 17 -2 -17 100 118 117 116 118 121 114 114 105 109 122 108 110 121 113 120 119 111 Record low temperatures by state in degrees Fahrenheit -27 -35 -80 -51 -40 -60 - 29 - 19 -40 -70 -47 -50 -46 -34 12 -60 -36 -36 -47 -40 -37 -16 -50 -40 104 111 -50 -52 -34 -60 -39 -27 -54 -42 -28 - 19 120 113 120 117 107 110 118 112 114 115 -58 -32 -23 -50 -50 -30 -48 -37 -55 -66
Step by Step Solution
3.46 Rating (166 Votes )
There are 3 Steps involved in it
ANSWER Here is the stem and leaf plot for the record low temperatures in th... View full answer

Get step-by-step solutions from verified subject matter experts