

Question: Using the data from Data Set X in Appendix B, classify the data as 13, 46, 79, etc. Use the chi-square goodness-of-fit test to see
Using the data from Data Set X in Appendix B, classify the data as 1–3, 4–6, 7–9, etc. Use the chi-square goodness-of-fit test to see if the number of times each ball is drawn is equally distributed.
Data from in Data set X
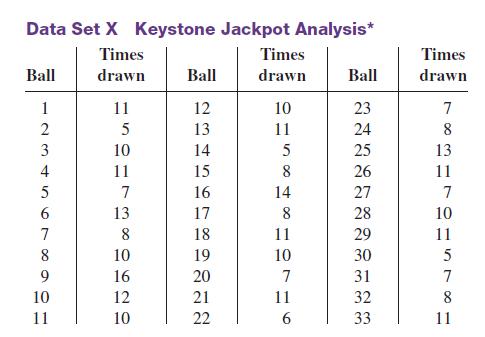
Data Set X Keystone Jackpot Analysis* Times drawn Ball 1 2 3 4 5 6 7 8 9 10 11 11 5 10 11 7 13 8 10 16 12 10 Ball 12 13 14 15 16 17 18 19 20 21 22 Times drawn 10 11 5 8 14 8 11 10 7 11 6 Ball 23 24 25 26 27 28 29 30 31 32 33 Times drawn 7 8 13 11 7 10 11 5 7 8 11
Step by Step Solution
3.60 Rating (157 Votes )
There are 3 Steps involved in it
ANSWER To classify the data into categories of 13 46 79 etc we need to determine the range of values that belong to each category In this case since t... View full answer

Get step-by-step solutions from verified subject matter experts