

Question: We have given population data for a variable. For each exercise, do the following tasks. a. Find the mean, , of the variable. b. For
We have given population data for a variable. For each exercise, do the following tasks.
a. Find the mean, μ, of the variable.
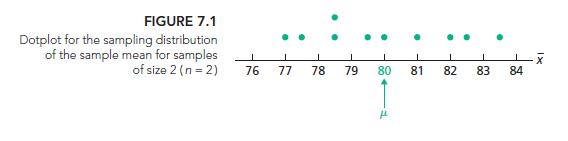
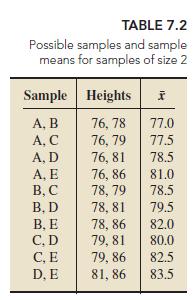
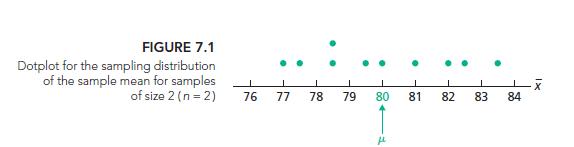
b. For each of the possible sample sizes, construct a table similar to Table 7.2 and draw a dotdot plot the sampling distribution of the sample mean similar to Fig. 7.1.
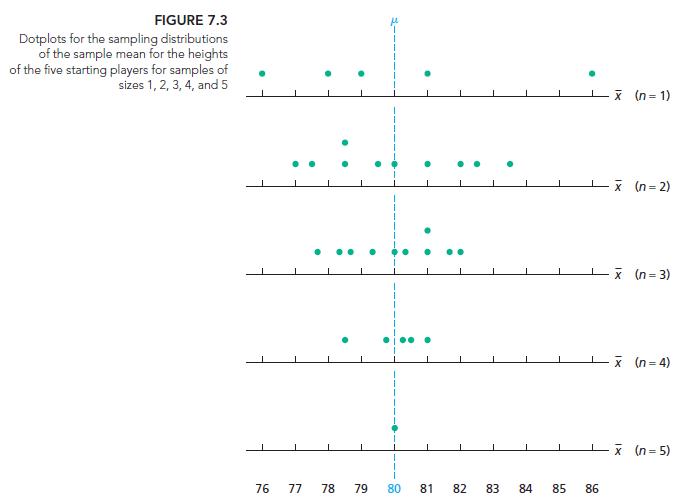
c. Construct a graph similar to Fig. 7.3 and interpret your results.
d. For each of the possible sample sizes, find the probability that the sample mean will equal the population mean.
e. For each of the possible sample sizes, find the probability that the sampling error made in estimating the population mean by the sample mean will be 0.5 or less (in magnitude), that is, the absolute value of the difference between the sample mean and the population mean is at most 0.5.
Population data: 2, 5, 8.
FIGURE 7.1 Dotplot for the sampling distribution of the sample mean for samples of size 2 (n=2) J 76 L I 77 78 1 79 L L 80 81 H I 82 83 LX 84
Step by Step Solution
3.47 Rating (160 Votes )
There are 3 Steps involved in it
a b c d The sample means cluster more closely around the population mean as the sample size increase... View full answer

Get step-by-step solutions from verified subject matter experts