

Question: We have provided a normal probability plot of data from a sample of a population. In each case, assess the normality of the variable under
We have provided a normal probability plot of data from a sample of a population. In each case, assess the normality of the variable under consideration.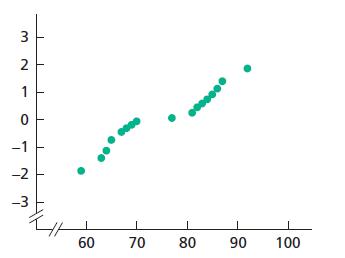
3 2 1 0 -1 -2 T 60 ******* I 70 80 90 100
Step by Step Solution
★★★★★
3.37 Rating (163 Votes )
There are 3 Steps involved in it
1 Expert Approved Answer
Step: 1 Unlock

The variable is not no... View full answer
Question Has Been Solved by an Expert!
Get step-by-step solutions from verified subject matter experts
Step: 2 Unlock
Step: 3 Unlock