

The pie chart at the left shows the responses of a sample of 352 small-business owners who
Question:
The pie chart at the left shows the responses of a sample of 352 small-business owners who were asked whether their business has a website.
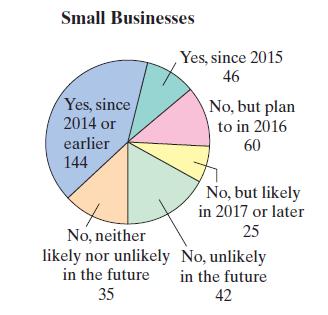
Find the mean, the median, and the mode of the data, if possible. If any measure cannot be found or does not represent the center of the data, explain why.
Fantastic news! We've Found the answer you've been seeking!
Step by Step Answer:

Answered By
Seema kuldeep
although I don't have an experience of teaching in a particular institute, previously I was an expert on Chegg and I have used to teach my batch mates and also my juniors.
1+ Reviews
10+ Question Solved
Related Book For 

Elementary Statistics Picturing The World
ISBN: 9781292260464
7th Global Edition
Authors: Betsy Farber, Ron Larson
Question Posted:
