

Question: Use a dot plot to display the data, which represent the blood glucose levels (in milligrams per deciliter) of 24 patients at a pathology laboratory.
Use a dot plot to display the data, which represent the blood glucose levels (in milligrams per deciliter) of 24 patients at a pathology laboratory.
Organize the data using the indicated type of graph. Describe any patterns.
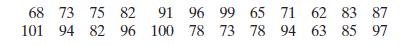
68 73 75 82 101 94 82 96 91 100 96 99 65 71 62 83 87 78 73 78 94 63 85 97
Step by Step Solution
★★★★★
3.48 Rating (148 Votes )
There are 3 Steps involved in it
1 Expert Approved Answer
Step: 1 Unlock

Blood glucose l... View full answer
Question Has Been Solved by an Expert!
Get step-by-step solutions from verified subject matter experts
Step: 2 Unlock
Step: 3 Unlock