

Question: Use a stem-and-leaf plot to display the data, which represent the humidity (in percentages) in the atmosphere as measured in 20 different days in a
Use a stem-and-leaf plot to display the data, which represent the humidity (in percentages) in the atmosphere as measured in 20 different days in a city.
Organize the data using the indicated type of graph. Describe any patterns.
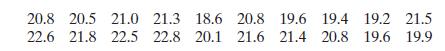
20.8 20.5 21.0 21.3 18.6 20.8 19.6 19.4 19.2 21.5 22.6 21.8 22.5 22.8 20.1 21.6 21.4 20.8 19.6 19.9
Step by Step Solution
★★★★★
3.47 Rating (160 Votes )
There are 3 Steps involved in it
1 Expert Approved Answer
Step: 1 Unlock

Most of th... View full answer
Question Has Been Solved by an Expert!
Get step-by-step solutions from verified subject matter experts
Step: 2 Unlock
Step: 3 Unlock