

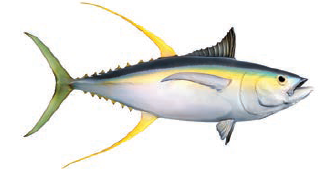
A marine biologist claims that the mean fork length (see figure at the left) of yellowfin tuna
Question:
A marine biologist claims that the mean fork length (see figure at the left) of yellowfin tuna is different in two zones in the eastern tropical Pacific Ocean. A sample of 26 yellowfin tuna collected in Zone A has a mean fork length of 76.2 centimeters and a standard deviation of 16.5 centimeters. A sample of 31 yellowfin tuna collected in Zone B has a mean fork length of 80.8 centimeters and a standard deviation of 23.4 centimeters. At α = 0.01, can you support the marine biologist’s claim? Assume the population variances are equal.
(a) Identify the claim and state H0 and Ha,
(b) Find the critical value(s) and identify the rejection region(s),
(c) Find the standardized test statistic t,
(d) Decide whether to reject or fail to reject the null hypothesis, and
(e) Interpret the decision in the context of the original claim. Assume the samples are random and independent, and the populations are normally distributed.
Step by Step Answer:
a The claim is the mean fork length of yellowfin tuna is ...View the full answer


Elementary Statistics Picturing The World
ISBN: 9780134683416
7th Edition
Authors: Ron Larson, Betsy Farber
