

Question: A member is selected at random from the population represented by the graph. Find the probability that the member selected at random is from the
A member is selected at random from the population represented by the graph. Find the probability that the member selected at random is from the shaded region of the graph. Assume the variable x is normally distributed.
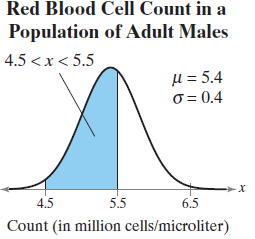
Red Blood Cell Count in a Population of Adult Males 4.5
Step by Step Solution
★★★★★
3.44 Rating (170 Votes )
There are 3 Steps involved in it
1 Expert Approved Answer
Step: 1 Unlock

Using techno... View full answer
Question Has Been Solved by an Expert!
Get step-by-step solutions from verified subject matter experts
Step: 2 Unlock
Step: 3 Unlock