

Question: Both data sets shown in the histograms have a mean of 50. One has a standard deviation of 2.4, and the other has a standard
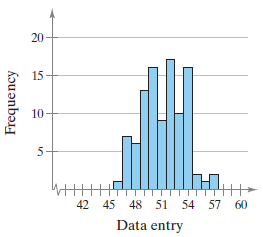
Both data sets shown in the histograms have a mean of 50. One has a standard deviation of 2.4, and the other has a standard deviation of 5. By looking at the histograms, which is which? Explain your reasoning.
(a)
(b)
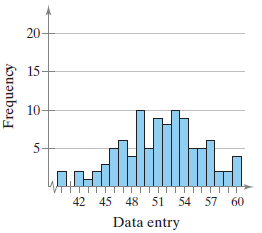
20 15 10 42 45 48 51 54 57 60 Data entry Frequency 15 10 5- 42 45 48 51 54 57 60 Data entry Frequency 20
Step by Step Solution
★★★★★
3.60 Rating (164 Votes )
There are 3 Steps involved in it
1 Expert Approved Answer
Step: 1 Unlock

The data set in a has a stan... View full answer
Question Has Been Solved by an Expert!
Get step-by-step solutions from verified subject matter experts
Step: 2 Unlock
Step: 3 Unlock