

Question: Construct a run chart for the 21 axial loads from the first three days, as listed below. Based on the result, does there appear to
Construct a run chart for the 21 axial loads from the first three days, as listed below. Based on the result, does there appear to be a pattern suggesting that the process is not within statistical control?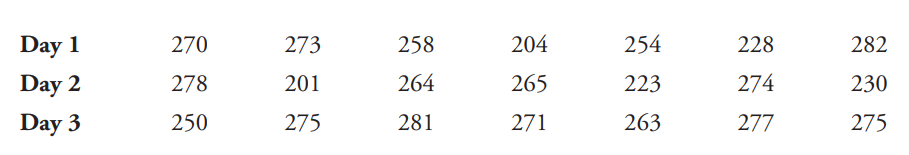
Day 1 270 273 258 204 254 228 282 Day 2 278 201 264 265 223 274 230 Day 3 250 275 281 271 263 277 275
Step by Step Solution
★★★★★
3.47 Rating (160 Votes )
There are 3 Steps involved in it
1 Expert Approved Answer
Step: 1 Unlock

A shift on a run chart is six or more consecutive points either all above or all below the median Va... View full answer
Question Has Been Solved by an Expert!
Get step-by-step solutions from verified subject matter experts
Step: 2 Unlock
Step: 3 Unlock