

Question: Construct a scatter plot for the data. Do the data appear to have a positive linear correlation, a negative linear correlation, or no linear correlation?
Construct a scatter plot for the data. Do the data appear to have a positive linear correlation, a negative linear correlation, or no linear correlation? Explain.
Use the data in the table, which shows the average annual salaries (both in thousands of dollars) for secondary and elementary school teachers, excluding special and vocational education teachers, in the United States for 11 years.
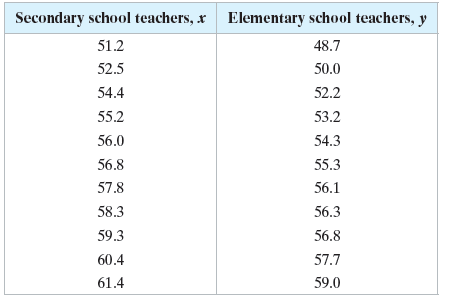
Secondary school teachers, x Elementary school teachers, y 51.2 48.7 52.5 50.0 54.4 52.2 55.2 53.2 56.0 54.3 56.8 55.3 57.8 56.1 58.3 56.3 56.8 59.3 57.7 60.4 61.4 59.0
Step by Step Solution
3.40 Rating (166 Votes )
There are 3 Steps involved in it
a y 23769 9181057 8413698 237208 mil... View full answer

Get step-by-step solutions from verified subject matter experts