

Question: Construct a scatterplot of the paired cholesterol weight data. Use the data in the table below, which are cholesterol levels (in mg per dL of
Construct a scatterplot of the paired cholesterol weight data.
Use the data in the table below, which are cholesterol levels (in mg per dL of blood) and corresponding weights (in lb) for randomly selected adult women from Data Set 1 in Appendix B.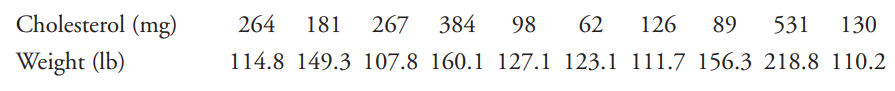
Cholesterol (mg) 264 181 267 384 98 62 126 89 531 130 Weight (Ib) 114.8 149.3 107.8 160.1 127.1 123.1 111.7 156.3 218.8 110.2
Step by Step Solution
★★★★★
3.30 Rating (159 Votes )
There are 3 Steps involved in it
1 Expert Approved Answer
Step: 1 Unlock

A scatter plot is drawn ta... View full answer
Question Has Been Solved by an Expert!
Get step-by-step solutions from verified subject matter experts
Step: 2 Unlock
Step: 3 Unlock