

Question: Construct one table (similar to Table 2-8 on page 51) that includes relative frequencies based on the frequency distributions from Exercises 5 and 6, then
Construct one table (similar to Table 2-8 on page 51) that includes relative frequencies based on the frequency distributions from Exercises 5 and 6, then compare the amounts of tar in nonfiltered and filtered cigarettes. Do the cigarette filters appear to be effective?
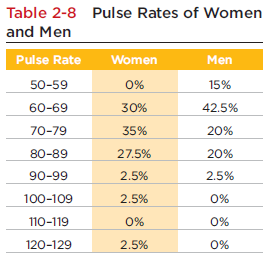
Table 2-8 Pulse Rates of Women and Men Pulse Rate Women Men 50-59 0% 15% 60-69 30% 42.5% 70-79 35% 20% 80-89 27.5% 20% 90-99 2.5% 2.5% 100-109 2.5% 0% 110-119 0% 0% 120-129 2.5% 0%
Step by Step Solution
3.38 Rating (170 Votes )
There are 3 Steps involved in it
We construct the relative frequency distribution for the amounts of tar in nonfi... View full answer

Get step-by-step solutions from verified subject matter experts
Document Format (2 attachments)
1545_605d88e212476_818101.pdf
180 KBs PDF File
1545_605d88e212476_818101.docx
120 KBs Word File