

Question: Construct the histogram that corresponds to the frequency distribution from Exercise 1. How does the result compare to the histogram for females (Figure 2-3)? 15
Construct the histogram that corresponds to the frequency distribution from Exercise 1. How does the result compare to the histogram for females (Figure 2-3)?
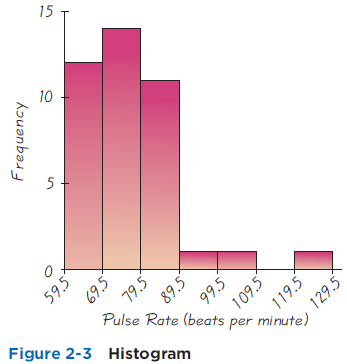
15 10 5 59.5 109.5 Pulse Rate (beats per minute) Figure 2-3 Histogram Frequency 69.5 79.5 89.5 99.5 119.5 129.5
Step by Step Solution
★★★★★
3.33 Rating (165 Votes )
There are 3 Steps involved in it
1 Expert Approved Answer
Step: 1 Unlock

We construct frequency distribution for the pulse rates of the males We choose the minimum data valu... View full answer
Question Has Been Solved by an Expert!
Get step-by-step solutions from verified subject matter experts
Step: 2 Unlock
Step: 3 Unlock
Document Format (2 attachments)
1545_605d88e20ff32_818058.pdf
180 KBs PDF File
1545_605d88e20ff32_818058.docx
120 KBs Word File