

Question: Data Set 2 in Appendix B includes 106 body temperatures for which x= 98.20?F and s = 0.62?F. a. What is the best point estimate
Data Set 2 in Appendix B includes 106 body temperatures for which x= 98.20?F and s = 0.62?F.
a. What is the best point estimate of the mean body temperature of all healthy humans?
b. Using the sample statistics, construct a 99% confidence interval estimate of the mean body temperature of all healthy humans. Do the confidence interval limits contain 98.6?F? What does the sample suggest about the use of 98.6?F as the mean body temperature?
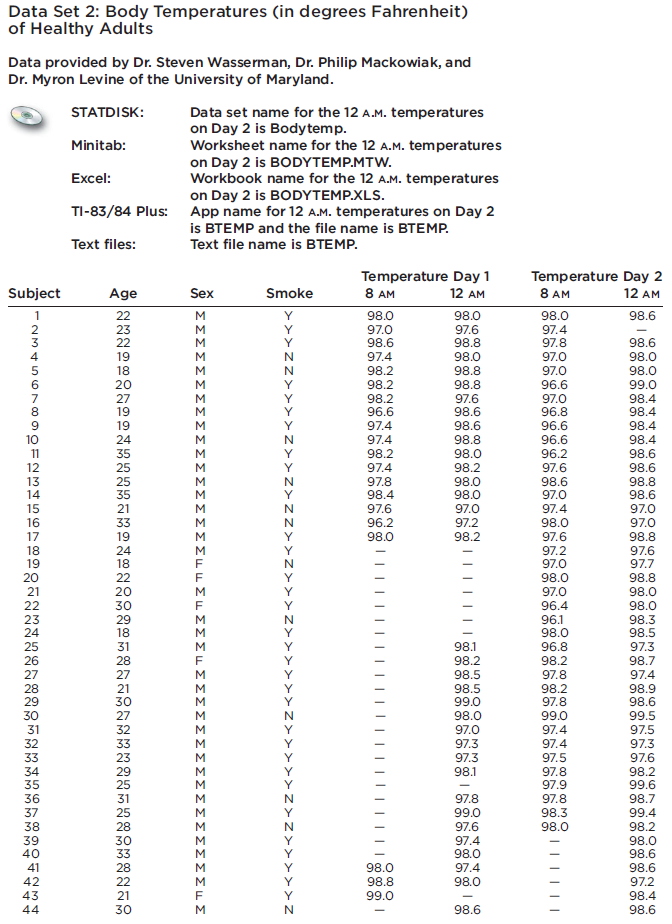
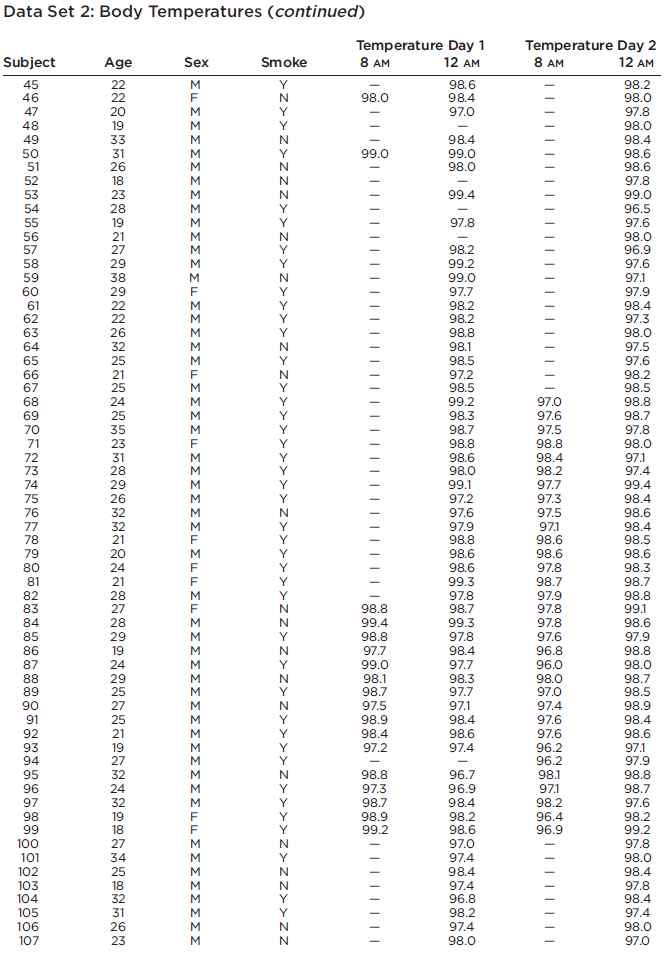
Data Set 2: Body Temperatures (in degrees Fahrenheit) of Healthy Adults Data provided by Dr. Steven Wasserman, Dr. Philip Mackowiak, and Dr. Myron Levine of the University of Maryland. STATDISK: Minitab: Subject 31 41 Excel: 43 TI-83/84 Plus: 1234567890123456718 19 20122 23 24 25 2627282930523435363839 4042544 NENORONDON-KENN Text files: Age 22 23 22 19 18 20 27 19 19 24 35 25 25 35 21 33 19 24 18 22 20 30 29 18 31 28 27 21 30 27 32 33 23 29 25 31 25 28 30 33 28 22 21 30 Data set name for the 12 A.M. temperatures on Day 2 is Body temp. Worksheet name for the 12 A.M. temperatures on Day 2 is BODYTEMP.MTW. Workbook name for the 12 A.M. temperatures on Day 2 is BODYTEMP.XLS. App name for 12 A.M. temperatures on Day 2 is BTEMP and the file name is BTEMP. Text file name is BTEMP. Sex M M M M M M M M M M M M M Smoke Y < < >>>> Z Temperature Day 1 8 AM 12 AM 98.0 97.0 98.6 97.4 98.2 98.2 98.2 96.6 97.4 97.4 98.2 97.4 97.8 98.4 97.6 96.2 98.0 98.0 98.8 99.0 1 98.0 97.6 98.8 98.0 98.8 98.8 97.6 98.6 98.6 98.8 98.0 98.2 98.0 98.0 97.0 97.2 98.2 98.1 98.2 98.5 98.5 99.0 98.0 97.0 97.3 97.3 98.1 97.8 99.0 97.6 97.4 98.0 97.4 98.0 98.6 Temperature Day 2 8 AM 12 AM 98.6 98.6 98.0 98.0 99.0 98.4 98.4 98.4 98.4 98.6 98.6 98.0 97.4 97.8 97.0 97.0 96.6 97.0 96.8 96.6 96.6 96.2 97.6 98.6 97.0 97.4 98.0 97.6 97.2 97.0 98.0 97.0 96.4 96.1 98.0 96.8 98.2 97.8 98.2 97.8 99.0 97.4 97.4 97.5 97.8 97.9 97.8 98.3 98.0 ||| 98.8 98.6 97.0 97.0 98.8 97.6 97.7 98.8 98.0 98.0 98.3 98.5 97.3 98.7 97.4 98.9 98.6 99.5 97.5 97.3 97.6 98.2 99.6 98.7 99.4 98.2 98.0 98.6 98.6 97.2 98.4 98.6 Data Set 2: Body Temperatures (continued) Subject 50 51 52 44799858-68RFNNKREARSONELLER NORMANNA522NONNONTON ZZYYZZ 53 55 60 61 62 63 66 70 71 72 73 77 80 81 82 83 90 91 92 93 100 101 102 103 104 105 106 Age 22 107 20 19 33 31 26 18 23 28 19 21 27 29 38 29 26 32 21 24 35 23 31 28 29 26 32 32 21 20 24 21 28 27 28 29 19 24 29 27 21 19 27 32 24 32 19 18 27 34 18 32 31 26 Sex M F M 23 Smoke Y N M Temperature Day 1 8 AM 12 AM 98.0 99.0 98.8 99.4 98.8 97.7 99.0 98.1 98.7 97.5 98.9 98.4 97.2 98.8 97.3 98.7 98.9 99.2 |||| 98.6 98.4 97.0 98.4 99.0 98.0 99.4 97.8 98.2 99.2 99.0 97.7 98.2 98.2 98.8 98.1 98.5 97.2 98.5 99.2 98.3 98.7 98.8 98.6 98.0 99.1 97.2 97.6 97.9 98.8 98.6 98.6 99.3 97.8 98.7 99.3 97.8 98.4 97.7 98.3 97.7 97.1 98.4 98.6 97.4 96.7 96.9 98.4 98.2 98.6 97.0 97.4 98.4 97.4 96.8 98.2 97.4 98.0 Temperature Day 2 8 AM 12 AM 97.0 97.6 97.5 98.8 98.4 98.2 97.7 97.3 97.5 97.1 98.6 98.6 97.8 98.7 97.9 97.8 97.8 97.6 96.8 96.0 98.0 97.0 97.4 97.6 97.6 96.2 96.2 98.1 97.1 98.2 96.4 96.9 |||||| 98.2 98.0 97.8 98.0 98.4 98.6 98.6 97.8 99.0 96.5 97.6 98.0 96.9 97.6 97.1 97.9 98.4 97.3 98.0 97.5 97.6 98.2 98.5 98.8 98.7 97.8 98.0 97.1 97.4 99.4 98.4 98.6 98.4 98.5 98.6 98.3 98.7 98.8 99.1 98.6 97.9 98.8 98.0 98.7 98.5 98.9 98.4 98.6 97.1 97.9 98.8 98.7 97.6 98.2 99.2 97.8 98.0 98.4 97.8 98.4 97.4 98.0 97.0
Step by Step Solution
3.42 Rating (168 Votes )
There are 3 Steps involved in it
a The best point estimate of the mean body temperature of all healthy human... View full answer

Get step-by-step solutions from verified subject matter experts