

Question: Example 4 showed that the 67 dependent April and September weight measurements from Data Set 3 in Appendix B result in this 95% confidence interval:
Example 4 showed that the 67 dependent April and September weight measurements from Data Set 3 in Appendix B result in this 95% confidence interval: 0.2 kg d 1 - ?2
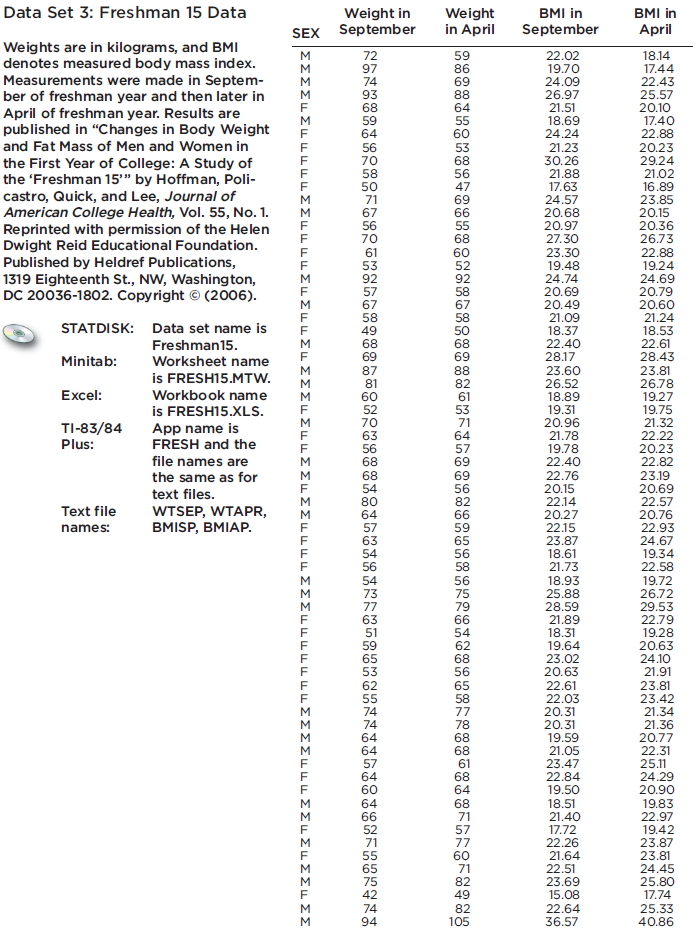
Data Set 3: Freshman 15 Data Weights are in kilograms, and BMI denotes measured body mass index. Measurements were made in Septem- ber of freshman year and then later in April of freshman year. Results are published in "Changes in Body Weight and Fat Mass of Men and Women in the First Year of College: A Study of the 'Freshman 15"" by Hoffman, Poli- castro, Quick, and Lee, Journal of American College Health, Vol. 55, No. 1. Reprinted with permission of the Helen Dwight Reid Educational Foundation. Published by Heldref Publications, 1319 Eighteenth St., NW, Washington, DC 20036-1802. Copyright (2006). STATDISK: Data set name is Minitab: Excel: TI-83/84 Plus: Text file names: Freshman15. Worksheet name is FRESH15.MTW. Workbook name is FRESH15.XLS. App name is FRESH and the file names are the same as for text files. WTSEP, WTAPR, BMISP, BMIAP. :3333333333333333333333333333333 SEX September Weight in Weight in April M uuuuuuuuu uuuuuuuuuuLu NOMORFRONah88-ONMOONNNNNNNNNNN M 72 97 74 93 68 64 56 70 58 50 71 67 56 70 61 53 92 57 67 58 49 68 69 87 81 60 52 70 63 56 68 68 54 80 64 57 63 54 56 77 63 51 53 62 55 74 74 64 64 57 64 60 64 66 52 71 55 65 75 42 74 94 888886*88%FF8* 59 69 64 55 60 53 56 47 69 66 55 60 52 92 58 67 58 69 82 61 53 71 64 57 69 69 56 82 66 59 65 56 58 56 75 79 66 54 62 56 65 58 77 78 61 64 71 57 77 60 71 82 49 82 105 BMI in September 22.02 19.70 24.09 26.97 21.51 18.69 24.24 21.23 30.26 21.88 17.63 24.57 20.68 20.97 27.30 23.30 19.48 24.74 20.69 20.49 21.09 18.37 22.40 28.17 23.60 26.52 18.89 19.31 20.96 21.78 19.78 22.40 22.76 20.15 22.14 20.27 22.15 23.87 18.61 21.73 18.93 25.88 28.59 21.89 18.31 19.64 23.02 20.63 22.61 22.03 20.31 20.31 19.59 21.05 23.47 22.84 19.50 18.51 21.40 17.72 22.26 21.64 22.51 23.69 15.08 22.64 36.57 BMI in April 18.14 17.44 22.43 25.57 20.10 17.40 22.88 20.23 29.24 21.02 16.89 23.85 20.15 20.36 26.73 22.88 19.24 24.69 20.79 20.60 21.24 18.53 22.61 28.43 23.81 26.78 19.27 19.75 21.32 22.22 20.23 22.82 23.19 20.69 22.57 20.76 22.93 24.67 19.34 22.58 19.72 26.72 29.53 22.79 19.28 20.63 24.10 21.91 23.81 23.42 21.34 21.36 20.77 22.31 25.11 24.29 20.90 19.83 22.97 19.42 23.87 23.81 24.45 25.80 17.74 25.33 40.86
Step by Step Solution
3.45 Rating (168 Votes )
There are 3 Steps involved in it
This confidence interval suggests that with 95 confid... View full answer

Get step-by-step solutions from verified subject matter experts