

Question: Find the indicated z-score(s) shown in the graph. Area = 0.0233
Find the indicated z-score(s) shown in the graph.
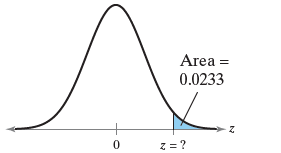
Area = 0.0233
Step by Step Solution
★★★★★
3.36 Rating (162 Votes )
There are 3 Steps involved in it
1 Expert Approved Answer
Step: 1 Unlock

Question Has Been Solved by an Expert!
Get step-by-step solutions from verified subject matter experts
Step: 2 Unlock
Step: 3 Unlock