

Question: Find the probability that a worker chosen at random is not employed in the services industry. Use the pie chart at the left, which shows
Find the probability that a worker chosen at random is not employed in the services industry.
Use the pie chart at the left, which shows the number of workers (in thousands) by industry for the United States.
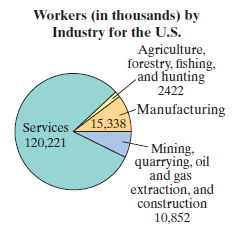
Workers (in thousands) by Industry for the U.S. Agriculture, forestry, fishing, cand hunting 2422 -Manufacturing Services 15,338 |120,221 - Mining, quarrying, oil and gas extraction, and construction 10,852
Step by Step Solution
★★★★★
3.47 Rating (150 Votes )
There are 3 Steps involved in it
1 Expert Approved Answer
Step: 1 Unlock

Pnot in serv... View full answer
Question Has Been Solved by an Expert!
Get step-by-step solutions from verified subject matter experts
Step: 2 Unlock
Step: 3 Unlock