

If we use subgroups of size corresponding to the rows of the table, and if we use
Question:
If we use subgroups of size corresponding to the rows of the table, and if we use all of the data from 25 days of production, we get the x? chart shown below. Interpret that x? chart.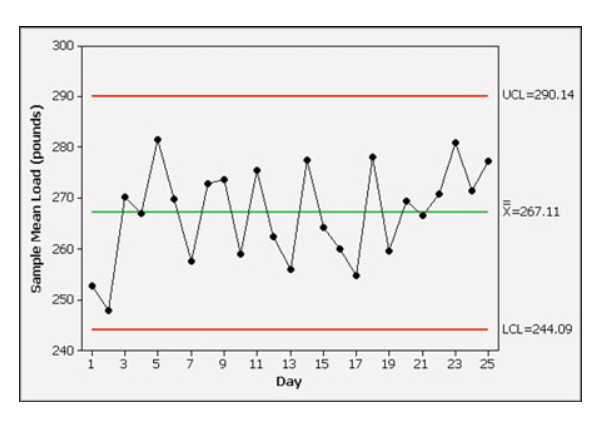
Fantastic news! We've Found the answer you've been seeking!
Step by Step Answer:
The Xbar chart plots the average of the measurements within each subgroup The center l...View the full answer

Answered By
Maruti Shinde
I completed my post graduation in Statistics from Solapur University Solapur, Maharashtra. l have technical skills such as R software, Minitab, Ms-excel which are useful to solve statistical problems.
l had participated in National conference on Statistics in social science research. I completed WordsMaya's advanced technical communication course.
I tutored mostly High school students privately after college and during the summer.
0 Reviews
10+ Question Solved
Related Book For 

Question Posted:
