

Question: Refer to Data Set 12 in Appendix B and use the sample amounts of home energy consumption (in kWh) to construct a 99% confidence interval
Refer to Data Set 12 in Appendix B and use the sample amounts of home energy consumption (in kWh) to construct a 99% confidence interval estimate of the standard deviation of all energy consumption amounts.
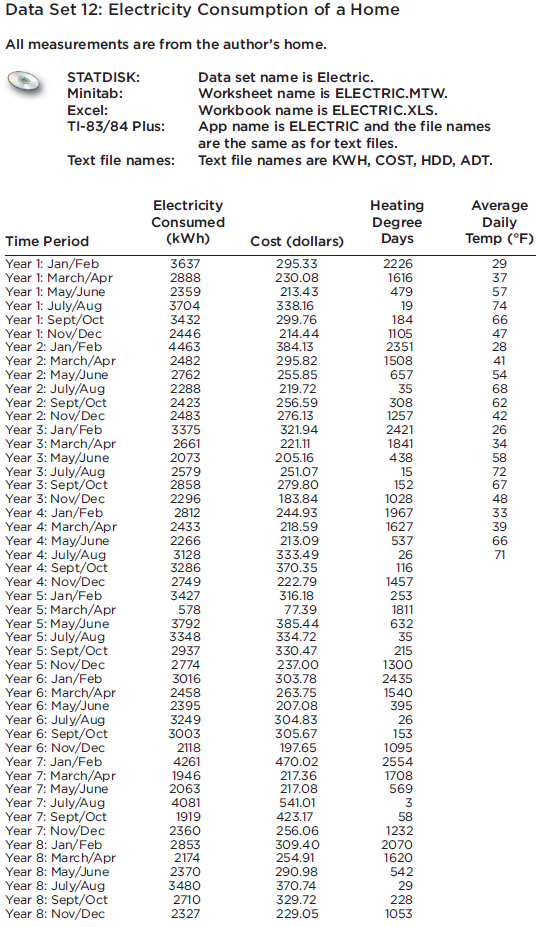
Data Set 12: Electricity Consumption of a Home All measurements are from the author's home. STATDISK: Minitab: Excel: TI-83/84 Plus: Text file names: Time Period Year 1: Jan/Feb Year 1: March/Apr Year 1: May/June Year 1: July/Aug Year 1: Sept/Oct Year 1: Nov/Dec Year 2: Jan/Feb Year 2: March/Apr Year 2: May/June Year 2: July/Aug Year 2: Sept/Oct Year 2: Nov/Dec Year 3: Jan/Feb Year 3: March/Apr Year 3: May/June Year 3: July/Aug Year 3: Sept/Oct Year 3: Nov/Dec Year 4: Jan/Feb Year 4: March/Apr Year 4: May/June Year 4: July/Aug Year 4: Sept/Oct Year 4: Nov/Dec Year 5: Jan/Feb Year 5: March/Apr Year 5: May/June Year 5: July/Aug Year 5: Sept/Oct Year 5: Nov/Dec Year 6: Jan/Feb Year 6: March/Apr Year 6: May/June Year 6: July/Aug Year 6: Sept/Oct Year 6: Nov/Dec Year 7: Jan/Feb Year 7: March/Apr Year 7: May/June Year 7: July/Aug Year 7: Sept/Oct Year 7: Nov/Dec Year 8: Jan/Feb Year 8: March/Apr Year 8: May/June Year 8: July/Aug Year 8: Sept/Oct Year 8: Nov/Dec Data set name is Electric. Worksheet name is ELECTRIC.MTW. Workbook name is ELECTRIC.XLS. App name is ELECTRIC and the file names are the same as for text files. Text file names are KWH, COST, HDD, ADT. Electricity Consumed (kWh) 3637 2888 2359 3704 3432 2446 4463 2482 2762 2288 2423 2483 3375 2661 2073 2579 2858 2296 2812 2433 2266 3128 3286 2749 3427 578 3792 3348 2937 2774 3016 2458 2395 3249 3003 2118 4261 1946 2063 4081 1919 2360 2853 2174 2370 3480 2710 2327 Cost (dollars) 295.33 230.08 213.43 338.16 299.76 214.44 384.13 295.82 255.85 219.72 256.59 276.13 321.94 221.11 205.16 251.07 279.80 183.84 244.93 218.59 213.09 333.49 370.35 222.79 316.18 77.39 385.44 334.72 330.47 237.00 303.78 263.75 207.08 304.83 305.67 197.65 470.02 217.36 217.08 541.01 423.17 256.06 309.40 254.91 290.98 370.74 329.72 229.05 Heating Degree Days 2226 1616 479 19 184 1105 2351 1508 657 35 308 1257 2421 1841 438 15 152 1028 1967 1627 537 26 116 1457 253 1811 632 35 215 1300 2435 1540 395 26 153 1095 2554 1708 569 3 58 1232 2070 1620 542 29 228 1053 Average Daily Temp (F) 29 37 57 74 4667 284468624226748248396 7 41 54 58 33 71
Step by Step Solution
3.51 Rating (164 Votes )
There are 3 Steps involved in it
To construct a 99 confidence interval estimate of the standard deviation of all energy consumption a... View full answer

Get step-by-step solutions from verified subject matter experts