

Question: Refer to Data Set 16 in Appendix B and use the weights of cars and the corresponding braking distances. Find the best predicted braking distance
Refer to Data Set 16 in Appendix B and use the weights of cars and the corresponding braking distances. Find the best predicted braking distance for a car that weighs 4000 lb.
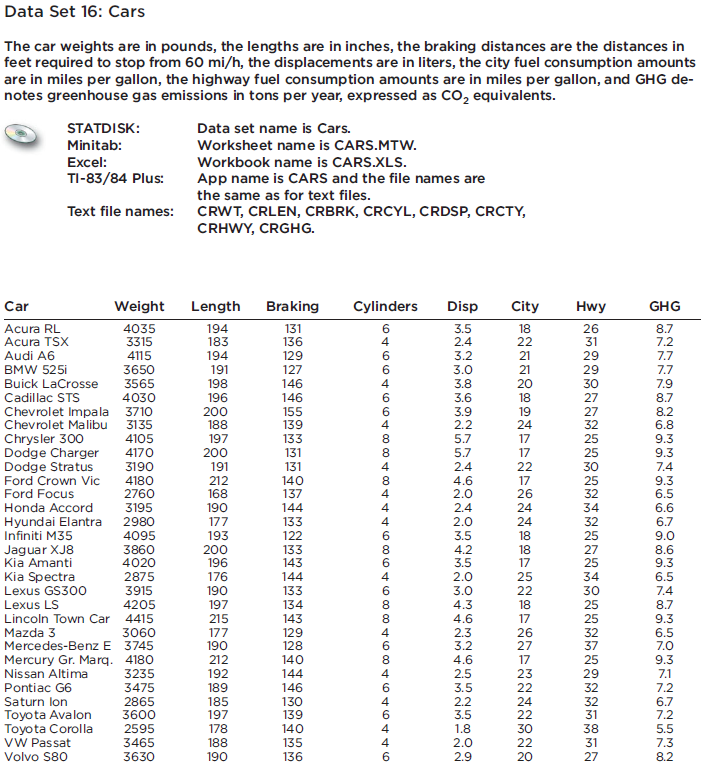
Data Set 16: Cars The car weights are in pounds, the lengths are in inches, the braking distances are the distances in feet required to stop from 60 mi/h, the displacements are in liters, the city fuel consumption amounts are in miles per gallon, the highway fuel consumption amounts are in miles per gallon, and GHG de- notes greenhouse gas emissions in tons per year, expressed as CO equivalents. STATDISK: Minitab: Excel: TI-83/84 Plus: Text file names: Car Acura RL Acura TSX Audi A6 BMW 525i Buick LaCrosse Cadillac STS Chevrolet Impala Chevrolet Malibu Chrysler 300 Dodge Charger Dodge Stratus Ford Crown Vic Ford Focus Honda Accord Hyundai Elantra Infiniti M35 Jaguar XJ8 Kia Amanti Kia Spectra Lexus GS300 Lexus LS Lincoln Town Car Mazda 3 Mercedes-Benz E Weight 4035 3315 4115 3650 3565 4030 3710 3135 4105 4170 3190 4180 2760 Mercury Gr. Marq. Nissan Altima Pontiac G6 Saturn lon Toyota Avalon Toyota Corolla VW Passat Volvo S80 3195 2980 4095 3860 4020 2875 3915 4205 4415 3060 3745 4180 3235 3475 2865 3600 2595 3465 3630 Data set name is Cars. Worksheet name is CARS.MTW. Workbook name is CARS.XLS. App name is CARS and the file names are the same as for text files. CRWT, CRLEN, CRBRK, CRCYL, CRDSP, CRCTY, CRHWY, CRGHG. Length 194 183 194 191 198 196 200 188 197 200 191 212 168 190 177 193 200 196 176 190 197 215 177 190 212 192 189 185 197 178 188 190 Braking 131 136 129 127 146 146 155 139 133 131 131 140 137 144 133 122 133 143 144 133 134 143 129 128 140 144 146 130 139 140 135 136 Cylinders Disp City 3.5 18 2.4 6466466+0000 60660000 6000+ 6+6446 8 8 4 4 4 3.2 3.0 3.8 3.6 3.9 2.2 5.7 5.7 2.4 4.6 2.0 2.4 2.0 3.5 4.2 3.5 2.0 3.0 4.3 4.6 2.3 3.2 4.6 2.5 3.5 2.2 3.5 1.8 2.0 2.9 NNNONDANDONNOOTSNOFONANNNNN 22 21 21 20 18 19 24 17 17 22 17 26 24 24 18 18 17 25 22 18 17 26 27 17 23 22 24 22 30 22 20 Hwy 26 888888888888888888888888888686 31 29 29 30 27 27 32 25 25 30 25 32 34 32 25 27 25 34 30 25 25 32 37 25 29 32 32 31 38 31 27 GHG 8.7 7.2 7.7 7.7 7.9 8.7 8.2 6.8 9.3 9.3 ioiNoir 7.4 M&M 9.3 6.5 6.6 6.7 9.0 8.6 9.3 6.5 7.4 8.7 9.3 SONONNONSNO 6.5 7.0 9.3 7.1 272532 7.2 6.7 7.2 5.5 7.3 8.2
Step by Step Solution
3.38 Rating (157 Votes )
There are 3 Steps involved in it
For this question we can use linear regression analysis to show th... View full answer

Get step-by-step solutions from verified subject matter experts