

Question: Refer to the two STATDISK-generated boxplots shown below that are drawn on the same scale. One boxplot represents weights of randomly selected men and the
Refer to the two STATDISK-generated boxplots shown below that are drawn on the same scale. One boxplot represents weights of randomly selected men and the other represents weights of randomly selected women. Which boxplot represents women? How do you know? Which boxplot depicts weights with more variation?
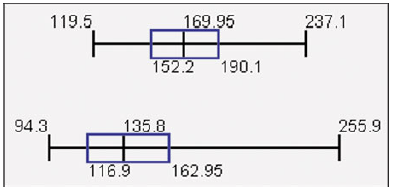
119.5 169.95 237.1 152.2 190.1 94.3 135.8 255.9 116.9 162.95
Step by Step Solution
3.51 Rating (158 Votes )
There are 3 Steps involved in it
Consider the diagram given below Consider the two STATDISKgenerated randomly selected Boxplot as ... View full answer

Get step-by-step solutions from verified subject matter experts
Document Format (2 attachments)
1545_605d88e216d35_818180.pdf
180 KBs PDF File
1545_605d88e216d35_818180.docx
120 KBs Word File