

Question: Table 2-2 is a frequency distribution summarizing the pulse rates of females (listed in Table 2-1), and Figure 2-3 is a histogram representing those same
Table 2-2 is a frequency distribution summarizing the pulse rates of females (listed in Table 2-1), and Figure 2-3 is a histogram representing those same pulse rates. When investigating the distribution of that data set, which is more effective: the frequency distribution or the histogram? Why?
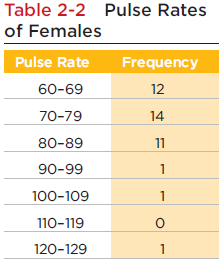
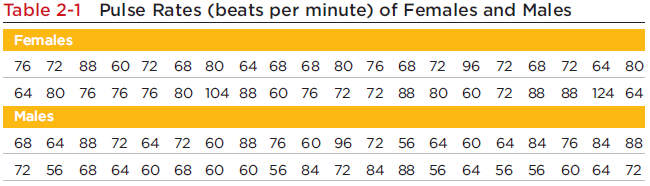
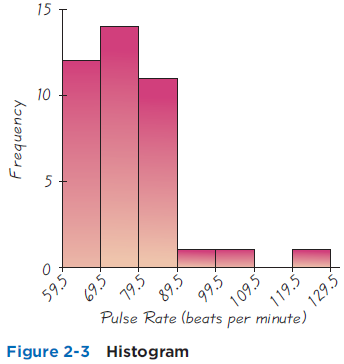
Table 2-2 Pulse Rates of Females Pulse Rate Frequency 60-69 12 70-79 14 80-89 11 90-99 1 100-109 1 110-119 120-129 1 Table 2-1 Pulse Rates (beats per minute) of Females and Males Females 76 72 88 6O 72 68 80 64 68 68 80 76 68 72 96 72 68 72 64 80 64 80 76 76 76 80 104 88 60 76 72 72 88 80 60 72 88 88 124 64 Males 68 64 88 72 64 72 60 88 76 60 96 72 56 64 60 64 84 76 84 88 56 68 64 60 68 60 60 56 84 72 84 88 56 64 56 56 60 64 72 72
Step by Step Solution
3.40 Rating (162 Votes )
There are 3 Steps involved in it
YesThe graph is mislea... View full answer

Get step-by-step solutions from verified subject matter experts
Document Format (2 attachments)
1545_605d88e20fa03_818051.pdf
180 KBs PDF File
1545_605d88e20fa03_818051.docx
120 KBs Word File