

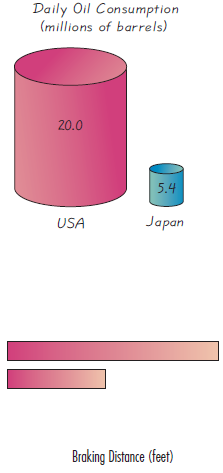
The accompanying graph uses cylinders to represent barrels of oil consumed by the United States and Japan.
Question:
The accompanying graph uses cylinders to represent barrels of oil consumed by the United States and Japan. Does the graph distort the data or does it depict the data fairly? Why or why not? If the graph distorts the data, construct a graph that depicts the data fairly.
Fantastic news! We've Found the answer you've been seeking!
Step by Step Answer:
The graphs of cylinders compairing the daily oil co...View the full answer

Answered By
Aubaid Itoo
I have recently completed my BS civil engineering. I m interested in teaching physics. Currently I am teaching physics of 11th and 12th standard. I believe that these 2 standards are carrier oriented standards for a student. I m teaching physics for entrances like NEET and IIT JEE. My aim of teaching is to clearing the concepts and doubt's in physics.Currently I m working in a SHINE TUTORIAL Jammu as tutor in physics for 11th,12th ,NEET and JEE. Recently I was selected as delegate in a international conference Named as International Youth leadership council (IYLC).
0 Reviews
10+ Question Solved
Related Book For 

Question Posted:
