

The graph of a population distribution is shown with its mean and standard deviation. Random samples of
Question:
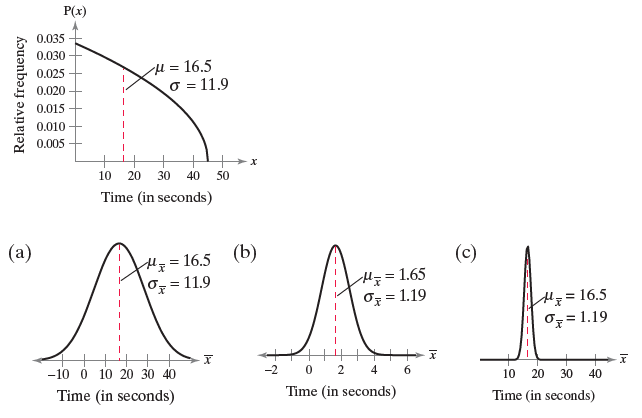
The graph of a population distribution is shown with its mean and standard deviation. Random samples of size 100 are drawn from the population. Determine which of the figures labeled (a)–(c) would most closely resemble the sampling distribution of sample means. Explain your reasoning.
The waiting time (in seconds) to turn left at an intersection.
The word "distribution" has several meanings in the financial world, most of them pertaining to the payment of assets from a fund, account, or individual security to an investor or beneficiary. Retirement account distributions are among the most...
Fantastic news! We've Found the answer you've been seeking!
Step by Step Answer:
c 119 Because ...View the full answer

Answered By
Khurram shahzad
I am an experienced tutor and have more than 7 years’ experience in the field of tutoring. My areas of expertise are Technology, statistics tasks I also tutor in Social Sciences, Humanities, Marketing, Project Management, Geology, Earth Sciences, Life Sciences, Computer Sciences, Physics, Psychology, Law Engineering, Media Studies, IR and many others.
I have been writing blogs, Tech news article, and listicles for American and UK based websites.
5+ Reviews
17+ Question Solved
Related Book For 

Elementary Statistics Picturing The World
ISBN: 9780134683416
7th Edition
Authors: Ron Larson, Betsy Farber
Question Posted:
