

The table shows the amounts of crude oil (in thousands of barrels per day) produced by the
Question:
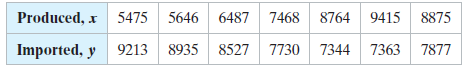
The table shows the amounts of crude oil (in thousands of barrels per day) produced by the United States and the amounts of crude oil (in thousands of barrels per day) imported by the United States for seven years. The equation of the regression line is ŷ = -0.438x + 11,404.947.
Use the data to
(a) Find the coefficient of determination r2 and interpret the result, and
(b) Find the standard error of estimate se and interpret the result.
Fantastic news! We've Found the answer you've been seeking!
Step by Step Answer:
a About 884 of the variation in the amount of crude oil imported can be e...View the full answer

Answered By
Salsabeel Ahmed
I have 5 years of experience in the field of Accounting, Costing, Financial reporting, Cost management and Finance. I have handled end to end projects in the above mentioned areas for various companies ranging from small firms to big corporate entities. Constantly I keep myself updated with recent developments and changes. I also ensure compliance with applicable reporting requirements such as IFRS and local GAAP (Generally Accepted Accounting Principles). Accounting, Costing and Finance knowledge helps to understand each transactions from different perspective, which in turns helps to provide valuable service and suggestions.
0 Reviews
10+ Question Solved
Related Book For 

Elementary Statistics Picturing The World
ISBN: 9780134683416
7th Edition
Authors: Ron Larson, Betsy Farber
Question Posted:
