

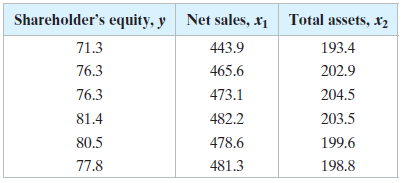
The table shows the net sales (in billions of dollars), total assets (in billions of dollars), and
Question:
The table shows the net sales (in billions of dollars), total assets (in billions of dollars), and shareholder’s equities (in billions of dollars) for Wal-Mart for six years.
Use technology to find
(a) The multiple regression equation for the data shown in the table,
(b) The standard error of estimate, and
(c) The coefficient of determination. Interpret the results.
Fantastic news! We've Found the answer you've been seeking!
Step by Step Answer:
a y 2969 0229x 0004x b s e 1847 The standard error ...View the full answer

Answered By
Muhammad Umair
I have done job as Embedded System Engineer for just four months but after it i have decided to open my own lab and to work on projects that i can launch my own product in market. I work on different softwares like Proteus, Mikroc to program Embedded Systems. My basic work is on Embedded Systems. I have skills in Autocad, Proteus, C++, C programming and i love to share these skills to other to enhance my knowledge too.
1+ Reviews
10+ Question Solved
Related Book For 

Elementary Statistics Picturing The World
ISBN: 9780134683416
7th Edition
Authors: Ron Larson, Betsy Farber
Question Posted:
