Question:
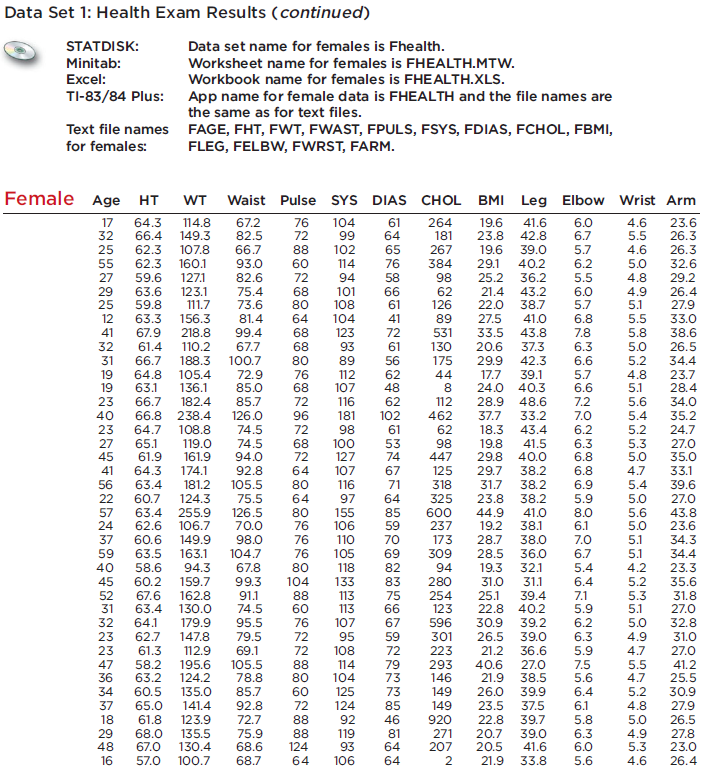
Use the 40 upper leg lengths (cm) listed for females from Data Set 1 in Appendix B. Construct a modified boxplot. Identify any outliers as defined in Part 2 of this section.
Transcribed Image Text:
Data Set 1: Health Exam Results (continued) STATDISK: Data set name for females is Fhealth. Minitab: Worksheet name for females is FHEALTH.MTW. Excel: Workbook name for females is FHEALTH.XLS. TI-83/84 Plus: App name for female data is FHEALTH and the file names are the same as for text files. Text file names FAGE, FHT, FWT, FWAST, FPULS, FSYS, FDIAS, FCHOL, FBMI, FLEG, FELBW, FWRST, FARM. for females: Female Age HT WT Waist Pulse SYS DIAS CHOL BMI Leg Elbow Wrist Arm 114.8 149.3 107.8 160.1 127.1 19.6 41.6 17 64.3 32 66.4 67.2 76 72 104 61 64 264 181 6.0 6.7 4.6 23.6 26.3 82.5 66.7 99 102 23.8 42.8 5.5 4.6 25 62.3 88 65 76 267 19.6 29.1 39.0 5.7 26.3 55 62.3 93.0 60 114 384 40.2 6.2 5.0 32.6 27 59.6 82.6 72 94 58 29.2 98 62 126 25.2 36.2 29 63.6 123.1 59.8 75.4 73.6 68 80 101 108 66 61 21.4 22.0 43.2 38.7 5.5 6.0 5.7 4.8 4.9 5.1 26.4 111.7 156.3 67.9 218.8 25 27.9 63.3 104 123 93 89 531 12 81.4 64 41 27.5 41.0 6.8 5.5 5.8 33.0 41 99.4 68 72 33.5 43.8 7.8 38.6 130 175 32 61.4 110.2 67.7 68 61 20.6 37.3 6.3 6.6 5.0 5.2 26.5 31 66.7 188.3 100.7 80 89 56 29.9 17.7 24.0 42.3 34.4 64.8 19 19 62 48 44 8 5.7 6.6 105.4 72.9 85.0 85.7 76 68 112 107 39.1 40.3 4.8 5.1 23.7 28.4 63.1 136.1 23 66.7 182.4 72 116 62 112 28.9 48.6 33.2 7.2 5.6 34.0 40 66.8 238.4 126.0 96 181 102 462 37.7 7.0 6.2 5.4 35.2 74.5 23 27 65.1 45 5.2 5.3 5.0 4.7 64.7 108.8 72 98 100 127 61 62 18.3 43.4 24.7 61.9 64.3 119.0 161.9 74.5 94.0 68 72 53 74 67 98 447 19.8 29.8 41.5 40.0 6.3 6.8 27.0 35.0 41 174.1 92.8 64 107 125 29.7 38.2 6.8 33.1 56 63.4 181.2 38.2 105.5 75.5 80 116 71 318 31.7 6.9 5.4 39.6 22 60.7 124.3 64 97 64 325 23.8 38.2 5.9 8.0 5.0 5.6 5.0 5.1 27.0 57 63.4 24 62.6 106.7 600 237 44.9 19.2 41.0 38.1 255.9 126.5 70.0 80 76 155 106 110 105 85 59 43.8 23.6 6.1 7.0 6.7 37 60.6 149.9 98.0 76 70 173 28.7 38.0 34.3 59 40 63.5 163.1 104.7 67.8 76 69 309 94 28.5 36.0 5.1 34.4 94.3 19.3 31.0 25.1 22.8 30.9 58.6 60.2 159.7 80 118 82 32.1 5.4 6.4 4.2 23.3 45 99.3 104 133 83 35.6 280 254 31.1 5.2 52 67.6 162.8 31 63.4 91.1 74.5 88 60 113 113 75 66 39.4 40.2 7.1 5.9 5.3 5.1 31.8 27.0 130.0 123 596 301 223 293 146 64.1 95.5 79.5 69.1 105.5 78.8 32 179.9 76 107 67 39.2 6.2 32.8 5.0 4.9 23 23 61.3 112.9 62.7 147.8 72 95 59 72 26.5 39.0 6.3 5.9 31.0 72 108 21.2 36.6 4.7 27.0 47 58.2 195.6 36 88 114 104 79 73 73 40.6 21.9 26.0 23.5 27.0 7.5 5.6 5.5 4.7 41.2 25.5 124.2 63.2 60.5 80 60 38.5 39.9 34 135.0 85.7 125 149 6.4 5.2 30.9 6.1 5.8 141.4 72 149 920 37 65.0 92.8 124 85 46 81 64 37.5 39.7 4.8 27.9 18 61.8 123.9 72.7 88 92 22.8 5.0 26.5 29 48 68.0 67.0 135.5 130.4 75.9 68.6 88 124 119 93 4.9 5.3 271 20.7 20.5 39.0 6.3 6.0 27.8 23.0 207 41.6 33.8 16 57.0 100.7 68.7 64 106 64 21.9 5.6 4.6 26.4 00 co MON6 S676 6567N 6666 n M00 00 6565


