

Question: Use the data set listed and technology to create frequency histograms with 5, 10, and 20 classes. Which graph displays the data best? Explain. 11
Use the data set listed and technology to create frequency histograms with 5, 10, and 20 classes. Which graph displays the data best? Explain.
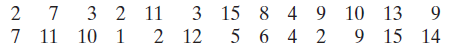
11 3 15 8 4 9 10 13 5 6 4 2 9. 2 7 3 2 9 15 14 11 10 1 2 12
Step by Step Solution
★★★★★
3.51 Rating (175 Votes )
There are 3 Steps involved in it
1 Expert Approved Answer
Step: 1 Unlock

In general a greater number of classes better preserves the actual values of the ... View full answer
Question Has Been Solved by an Expert!
Get step-by-step solutions from verified subject matter experts
Step: 2 Unlock
Step: 3 Unlock