

Question: Use the information provided in the display to determine the value of the linear correlation coefficient. (Caution: Be careful to correctly identify the sign of
Use the information provided in the display to determine the value of the linear correlation coefficient. (Caution: Be careful to correctly identify the sign of the correlation coefficient.) Given that there are 32 pairs of data, is there sufficient evidence to support a claim of a linear correlation between the weights of cars and their highway fuel consumption amounts?
Refer to the Minitab display obtained by using the paired data consisting of weights (in lb) of 32 cars and their highway fuel consumption amounts (in mi gal), as listed in Data Set 16 in Appendix B. Along with the paired sample data, Minitab was also given a car weight of 4000 lb to be used for predicting the highway fuel consumption amount.
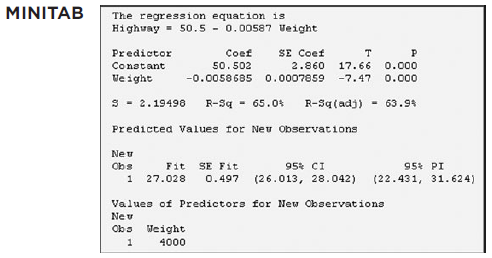
MINITAB The regression equation is Highway 50.5 0.00587 Weight Predictor Constant Weight Coef 50.502 T P 17.66 0.000 -0.0058685 0.0007859 -7.47 0.000 -2.19498 R-Sq 65.0% R-Sq (adj) 63.9% Neu Obs SE Coef 2.860 Predicted Values for Neu Observations Fit SE Fit 1 27.028 0.497 95% CI 95% PI (26.013, 28.042) (22.431, 31.624) Values of Predictors for New Observations Ne v Obs Weight 1 4000
Step by Step Solution
3.39 Rating (168 Votes )
There are 3 Steps involved in it
The correlation coefficient is 0 7 34 Yes there is sufficient ... View full answer

Get step-by-step solutions from verified subject matter experts