

Question: Using Data Set 1 in Appendix B, a researcher pairs pulse rates and cholesterol levels for the 40 women. Can the methods of this section
Using Data Set 1 in Appendix B, a researcher pairs pulse rates and cholesterol levels for the 40 women. Can the methods of this section be used to construct a confidence interval? Why or why not?
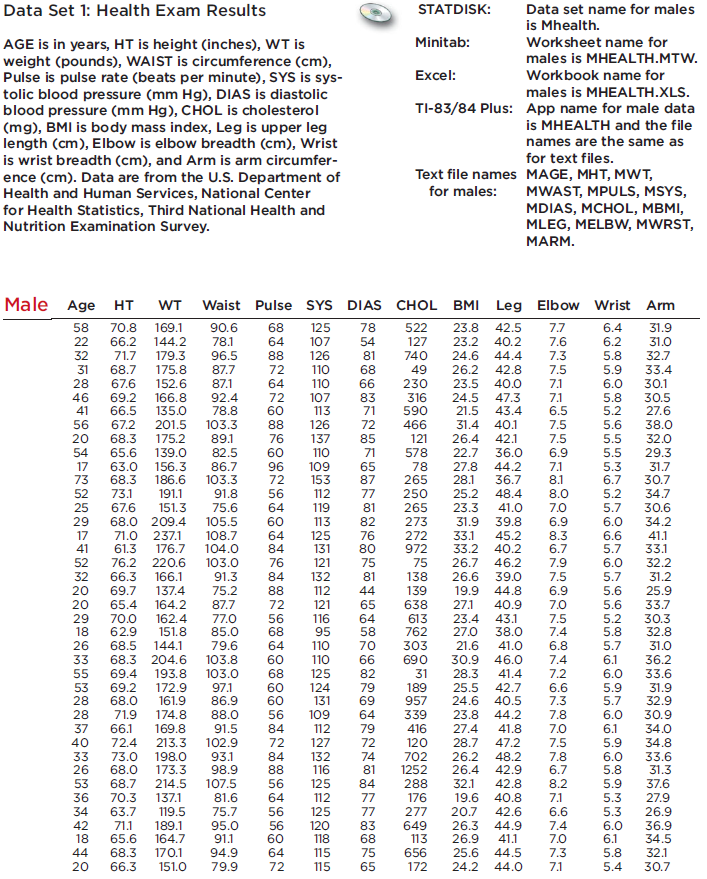
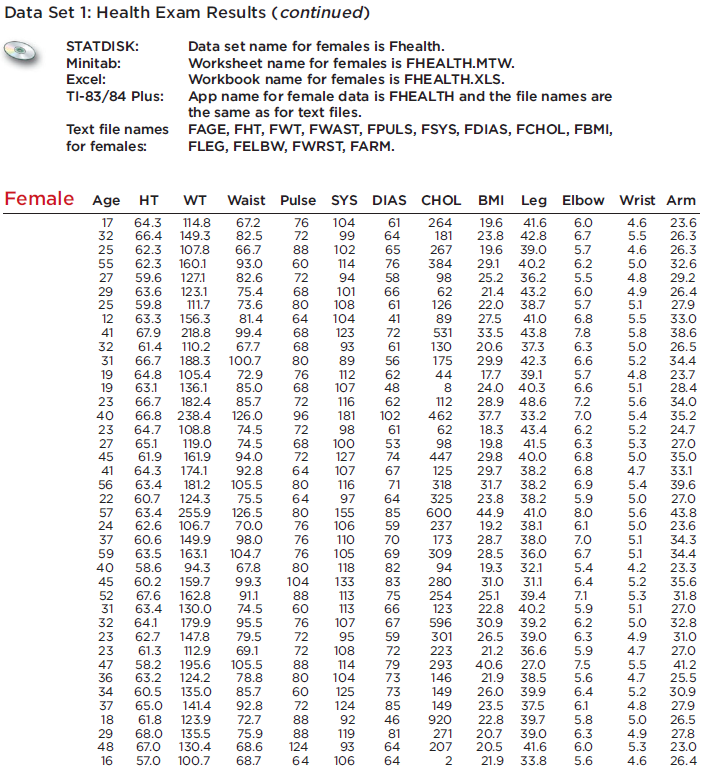
Data Set 1: Health Exam Results AGE is in years, HT is height (inches), WT is weight (pounds), WAIST is circumference (cm), Pulse is pulse rate (beats per minute), SYS is sys- tolic blood pressure (mm Hg), DIAS is diastolic blood pressure (mm Hg), CHOL is cholesterol (mg), BMI is body mass index, Leg is upper leg length (cm), Elbow is elbow breadth (cm), Wrist is wrist breadth (cm), and Arm is arm circumfer- ence (cm). Data are from the U.S. Department of Health and Human Services, National Center for Health Statistics, Third National Health and Nutrition Examination Survey. Male Age HT WT 64 107 58 70.8 169.1 90.6 68 125 22 66.2 144.2 78.1 32 71.7 179.3 96.5 88 31 68.7 87.7 72 175.8 28 67.6 152.6 87.1 64 110 72 107 60 46 69.2 166.8 41 66.5 135.0 34 42 18 44 20 Waist Pulse SYS DIAS 78 189.1 164.7 68.3 170.1 66.3 151.0 92.4 78.8 56 67.2 201.5 103.3 88 20 68.3 175.2 89.1 76 54 139.0 82.5 60 91.8 65.6 17 63.0 156.3 86.7 96 73 68.3 186.6 103.3 72 52 73.1 191.1 56 25 67.6 151.3 75.6 64 29 68.0 209.4 105.5 60 17 71.0 237.1 108.7 64 41 61.3 176.7 104.0 84 52 76.2 220.6 103.0 76 121 32 66.3 166.1 69.7 137.4 112 91.3 84 132 20 75.2 88 20 65.4 164.2 87.7 72 29 70.0 162.4 77.0 18 62.9 151.8 85.0 68 26 68.5 144.1 79.6 64 60 33 68.3 204.6 103.8 110 55 69.4 193.8 103.0 68 125 53 69.2 172.9 97.1 60 124 28 68.0 161.9 60 56 109 84 112 37 40 33 73.0 198.0 86.9 28 71.9 174.8 88.0 66.1 169.8 91.5 72.4 213.3 102.9 72 127 93.1 84 132 98.9 88 116 26 68.0 173.3 53 68.7 214.5 107.5 56 125 36 70.3 137.1 63.7 119.5 71.1 65.6 126 110 81.6 64 75.7 95.0 91.1 94.9 79.9 113 126 137 110 109 153 112 119 113 125 131 110 131 112 56 125 56 120 60 118 64 72 115 416866 31 2 85 76582 6 80 5146545870629696492443687565 115 54 83 121 56 116 64 95 71 72 Data set name for males is Mhealth. Minitab: Worksheet name for males is MHEALTH.MTW. Workbook name for males is MHEALTH.XLS. Excel: TI-83/84 Plus: App name for male data is MHEALTH and the file names are the same as for text files. 76 STATDISK: Text file names for males: CHOL BMI 522 23.8 42.5 127 740 49 230 316 590 466 121 26.4 71 578 22.7 78 265 77 250 81 265 273 272 972 75 75 7.5 7.5 6.9 7.1 8.1 48.4 8.0 7.0 6.9 33.1 45.2 8.3 33.2 40.2 6.7 26.7 46.2 7.9 26.6 39.0 7.5 138 139 19.9 44.8 6.9 638 27.1 40.9 7.0 613 23.4 43.1 7.5 27.0 38.0 7.4 41.0 6.8 7.4 7.2 762 303 21.6 690 82 31 79 189 957 24.6 339 23.8 44.2 7.8 416 27.4 41.8 7.0 120 28.7 47.2 702 26.2 48.2 30.9 46.0 28.3 41.4 25.5 42.7 40.5 6.6 7.3 7.5 7.8 1252 26.4 42.9 6.7 8.2 7.1 6.6 7.4 7.0 7.3 7.1 Leg Elbow Wrist Arm MAGE, MHT, MWT, MWAST, MPULS, MSYS, MDIAS, MCHOL, MBMI, MLEG, MELBW, MWRST, MARM. 7.7 23.2 40.2 7.6 24.6 44.4 7.3 26.2 42.8 7.5 23.5 40.0 7.1 24.5 47.3 7.1 21.5 43.4 6.5 31.4 40.1 42.1 36.0 36.7 27.8 44.2 28.1 25.2 23.3 41.0 31.9 39.8 288 32.1 42.8 19.6 40.8 176 277 20.7 42.6 649 26.3 44.9 113 26.9 41.1 656 25.6 44.5 172 24.2 44.0 6.4 6.2 5.8 5.9 6.0 5.8 5.2 5.6 38.0 5.5 32.0 5.5 29.3 5.3 31.7 6.7 30.7 5.2 5.7 6.0 6.6 5.7 6.0 5.7 5.6 5.6 5.9 5.7 6.0 6.1 5.9 56655 25.9 33.7 5.2 30.3 5.8 32.8 5.7 31.0 6.1 36.2 6.0 33.6 31.9 32.9 30.9 34.0 34.8 6.0 33.6 5.8 31.3 30184 6.0 31.9 31.0 6.1 5.8 32.7 33.4 5.9 37.6 5.3 27.9 5.3 26.9 5.4 30.1 30.5 27.6 34.7 30.6 34.2 41.1 33.1 32.2 31.2 36.9 34.5 32.1 30.7 Data Set 1: Health Exam Results (continued) STATDISK: Minitab: Excel: TI-83/84 Plus: Text file names for females: Data set name for females is Fhealth. Worksheet name for females is FHEALTH.MTW. Workbook name for females is FHEALTH.XLS. App name for female data is FHEALTH and the file names are the same as for text files. FAGE, FHT, FWT, FWAST, FPULS, FSYS, FDIAS, FCHOL, FBMI, FLEG, FELBW, FWRST, FARM. Female Age HT WT Waist Pulse SYS DIAS 76 104 72 99 88 102 17 64.3 114.8 67.2 32 66.4 149.3 82.5 25 62.3 107.8 66.7 55 62.3 160.1 93.0 60 27 59.6 127.1 29 63.6 123.1 114 76 82.6 72 94 58 75.4 68 101 66 25 111.7 73.6 80 108 61 59.8 12 63.3 156.3 81.4 64 41 67.9 218.8 99.4 68 32 61.4 110.2 67.7 68 31 66.7 188.3 100.7 80 72.9 76 19 64.8 105.4 19 63.1 136.1 66.7 182.4 85.0 68 107 48 85.7 72 23 40 66.8 238.4 126.0 96 23 64.7 108.8 74.5 72 27 65.1 119.0 74.5 68 45 161.9 94.0 61.9 41 64.3 174.1 56 63.4 181.2 22 60.7 124.3 57 63.4 255.9 24 62.6 106.7 75.5 64 126.5 80 70.0 76 37 60.6 149.9 98.0 76 59 63.5 163.1 104.7 40 58.6 94.3 67.8 45 60.2 159.7 99.3 52 67.6 162.8 91.1 31 63.4 130.0 74.5 32 64.1 95.5 179.9 23 62.7 147.8 79.5 23 61.3 112.9 69.1 47 58.2 195.6 105.5 104 88 60 72 92.8 64 107 105.5 80 104 123 88 78.8 80 93 36 63.2 124.2 34 60.5 135.0 37 65.0 141.4 92.8 72 18 61.8 123.9 72.7 88 88 89 112 29 68.0 135.5 75.9 48 67.0 130.4 68.6 124 16 57.0 100.7 68.7 64 100 127 76 105 80 118 133 113 113 116 116 181 102 98 97 76 107 72 95 72 108 155 106 110 114 104 85.7 60 125 124 92 119 93 61 64 65 106 41 25624862 102 1374 7 72 61 61 53 59 CHOL BMI Leg Elbow 264 19.6 41.6 6.0 181 23.8 42.8 6.7 19.6 5.7 39.0 29.1 40.2 6.2 25.2 36.2 5.5 27933546864 64 267 384 98 81 62 126 89 27.5 41.0 531 33.5 43.8 20.6 37.3 130 175 44 67 596 301 223 293 146 149 149 920 8 112 462 62 98 447 21.4 43.2 22.0 38.7 271 207 2 Wrist Arm 4.6 23.6 5.5 26.3 4.6 26.3 5.0 32.6 4.8 29.2 4.9 26.4 5.1 27.9 5.5 33.0 5.8 5.0 5.2 4.8 5.1 5.6 7.0 5.4 5.2 5.3 19.8 41.5 29.8 40.0 67 125 29.7 38.2 318 71 31.7 38.2 64 325 23.8 38.2 85 600 44.9 41.0 59 237 19.2 38.1 70 28.7 38.0 173 69 309 28.5 36.0 6.7 94 5.4 82 83 280 75 254 123 66 6.0 5.7 6.8 7.8 6.3 29.9 42.3 6.6 17.7 39.1 24.0 40.3 28.9 48.6 37.7 33.2 18.3 43.4 6.2 6.3 6.8 5.0 6.8 4.7 5.7 6.6 7.2 6.9 5.4 5.9 8.0 6.1 7.0 6.4 7.1 5.9 6.2 40.6 27.0 7.5 5.6 21.9 38.5 26.0 39.9 6.4 23.5 5.0 5.6 19.3 32.1 31.0 31.1 25.1 39.4 22.8 40.2 30.9 39.2 26.5 39.0 6.3 4.9 21.2 36.6 5.9 4.7 37.5 6.1 22.8 39.7 5.8 6.3 20.7 39.0 20.5 41.6 6.0 21.9 33.8 5.6 5.0 5.1 5.1 4.2 5.2 5.3 5.1 5.0 5.5 4.7 5.2 4.8 5.0 4.9 5.3 4.6 38.6 26.5 34.4 23.7 28.4 34.0 35.2 24.7 27.0 35.0 33.1 39.6 27.0 43.8 23.6 34.3 34.4 23.3 35.6 31.8 27.0 32.8 31.0 27.0 41.2 25.5 30.9 27.9 26.5 27.8 23.0 26.4
Step by Step Solution
3.50 Rating (173 Votes )
There are 3 Steps involved in it
Answer No the methods of this section cannot be used to construct a confidence in... View full answer

Get step-by-step solutions from verified subject matter experts