

Question: When data are summarized in a frequency distribution, the median can be found by first identifying the median class (the class that contains the median).
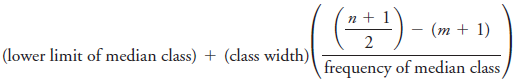
When data are summarized in a frequency distribution, the median can be found by first identifying the median class (the class that contains the median). We then assume that the values in that class are evenly distributed and we can interpolate. Letting n denote the sum of all class frequencies, and letting m denote the sum of the class frequencies that precede the median class, the median can be estimated as shown below.
Use this procedure to find the median of the frequency distribution given in Exercise 29. How does the result compare to the median of the original list of data, which is 20.0 mg? Which value of the median is better: the value computed for the frequency table or the value of 20.0 mg?
(";-) n + (m + 1) (lower limit of median class) + (class width) frequency of median class
Step by Step Solution
3.38 Rating (164 Votes )
There are 3 Steps involved in it
We have a data as given below Tar mg in Nonfiltered cigarettes Frequency 1013 1 14... View full answer

Get step-by-step solutions from verified subject matter experts
Document Format (2 attachments)
1545_605d88e21c50d_818296.pdf
180 KBs PDF File
1545_605d88e21c50d_818296.docx
120 KBs Word File