

Question: Car Crash Tests If we use the data described in Exercise 1 with two-way analysis of variance, we get the accompanying display. What do you
Car Crash Tests If we use the data described in Exercise 1 with two-way analysis of variance, we get the accompanying display. What do you conclude?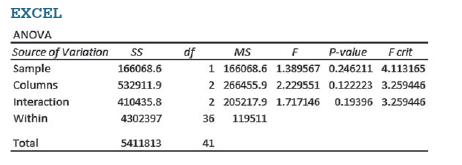
EXCEL MS F P-value F crit 1 166068.6 1.389567 0.246211 4.113165 2 266455.9 2.229551 0.122223 3.259446 2 205217.9 1.717146 0.19396 3.259446 36 119511 ANOVA Source of Variation SS df Sample 166068.6 Columns 532911.9 Interaction 410435.8 Within 4302397 Total 5411813 41
Step by Step Solution
There are 3 Steps involved in it
1 Expert Approved Answer
Step: 1 Unlock

Question Has Been Solved by an Expert!
Get step-by-step solutions from verified subject matter experts
Step: 2 Unlock
Step: 3 Unlock