

Question: Construct and interpret an interaction plot for the data in Exercise 24. Exercise 24 The following table presents measurements of the tensile strength (in kilopascals)
Construct and interpret an interaction plot for the data in Exercise 24.
Exercise 24
The following table presents measurements of the tensile strength (in kilopascals) of asphalt-rubber concrete beams for three levels of binder content and three levels of rubber content.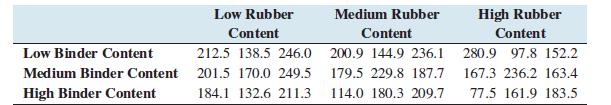
Low Binder Content Medium Binder Content High Binder Content Low Rubber Content 212.5 138.5 246.0 201.5 170.0 249.5 184.1 132.6 211.3 Medium Rubber Content 200.9 144.9 236.1 179.5 229.8 187.7 114.0 180.3 209.7 High Rubber Content 280.9 97.8 152.2 167.3 236.2 163.4 77.5 161.9 183.5
Step by Step Solution
3.44 Rating (157 Votes )
There are 3 Steps involved in it
Given tensile strength in kilopascals of asphalt beams is compared based on two factors levels of binder content and levels of rubber content Given ta... View full answer

Get step-by-step solutions from verified subject matter experts