

Question: Construct and interpret an interaction plot for the data in Exercise 15. Exercise 15 An education professor wants to find out which subject students find
Construct and interpret an interaction plot for the data in Exercise 15.
Exercise 15
An education professor wants to find out which subject students find most difficult. She obtains final exam scores for three randomly selected freshmen and three randomly selected sophomores from three subjects, statistics, psychology, and history. The results are as follows.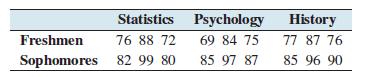
Freshmen Statistics Psychology 76 88 72 69 84 75 Sophomores 82 99 80 85 97 87 History 77 87 76 85 96 90
Step by Step Solution
3.44 Rating (154 Votes )
There are 3 Steps involved in it
To construct and interpret an interaction plot we visualize how the exam scores differ between Fresh... View full answer

Get step-by-step solutions from verified subject matter experts