

Question: Construct and interpret an interaction plot for the data in Exercise 16. Exercise 16 Vermont maple sugar producers sponsored a testing program to determine the
Construct and interpret an interaction plot for the data in Exercise 16.
Exercise 16
Vermont maple sugar producers sponsored a testing program to determine the benefit of a new fertilizer. A random sample of 27 maple trees in Vermont were chosen and treated with one of three levels of fertilizer. In this experimental setup, nine trees (three in each of three climatic zones) were treated with each fertilizer level and the amount of sap produced (in milliliters) by the trees was measured. The results are as follows.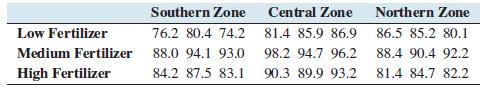
Low Fertilizer Medium Fertilizer High Fertilizer Southern Zone 76.2 80.4 74.2 88.0 94.1 93.0 84.2 87.5 83.1 Central Zone 81.4 85.9 86.9 98.2 94.7 96.2 90.3 89.9 93.2 Northern Zone 86.5 85.2 80.1 88.4 90.4 92.2 81.4 84.7 82.2
Step by Step Solution
There are 3 Steps involved in it
Given table of test with three level of Fertilizer in three zones The Obtained values of sap produced by sample of trees is given in the table in mill... View full answer

Get step-by-step solutions from verified subject matter experts