

Question: In Exercises 516, test the given claim. Identify the null hypothesis, alternative hypothesis, test statistic, P-value, or critical value(s), then state the conclusion about the
In Exercises 5–16, test the given claim. Identify the null hypothesis, alternative hypothesis, test statistic, P-value, or critical value(s), then state the conclusion about the null hypothesis, as well as the final conclusion that addresses the original claim. Assume that a simple random sample is selected from a normally distributed population.
Plain M&M candies are fairly consistent in their sizes, but Data Set 38 “Candies” shows that their weights do vary. Here are the stati0.87240.8724stics for the weights of a sample of the M&M candies listed in that data set: n = 20, x = 0.8724 g, s = 0.0337 g. If it is a goal to manufacture M&Ms so that they have weights with a standard deviation less than 0.0400 g, does the sample of M&Ms appear to satisfy that goal? Use a significance level of 0.01.
Data Set 38: Candies
Weights (grams) from M&M plain candies listed by color, Hershey’s Kisses, and Reese’s Peanut Butter Cup Miniatures (first five rows shown here). Data collected and later eaten by the author.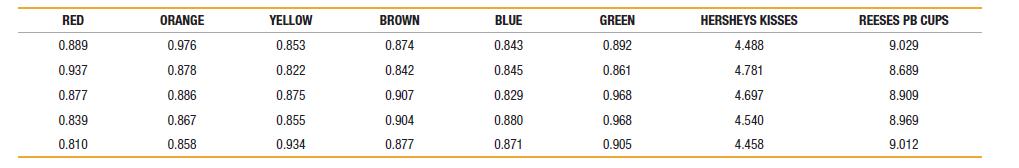
RED 0.889 0.937 0.877 0.839 0.810 ORANGE 0.976 0.878 0.886 0.867 0.858 YELLOW 0.853 0.822 0.875 0.855 0.934 BROWN 0.874 0.842 0.907 0.904 0.877 BLUE 0.843 0.845 0.829 0.880 0.871 GREEN 0.892 0.861 0.968 0.968 0.905 HERSHEYS KISSES 4.488 4.781 4.697 4.540 4.458 REESES PB CUPS 9.029 8.689 8.909 8.969 9.012
Step by Step Solution
3.51 Rating (161 Votes )
There are 3 Steps involved in it
Null Hypothesis H0 The population standard deviation of MM candy weights is greater than or equal to ... View full answer

Get step-by-step solutions from verified subject matter experts